
Fitxer:2005orange.PNG
Mida d'aquesta previsualització: 800 × 351 píxels. Altres resolucions: 320 × 140 píxels | 640 × 281 píxels | 1.425 × 625 píxels.
Fitxer original (1.425 × 625 píxels, mida del fitxer: 60 Ko, tipus MIME: image/png)
| Aquest fitxer i la informació mostrada a continuació provenen del dipòsit multimèdia lliure Wikimedia Commons. |
| Descripció |
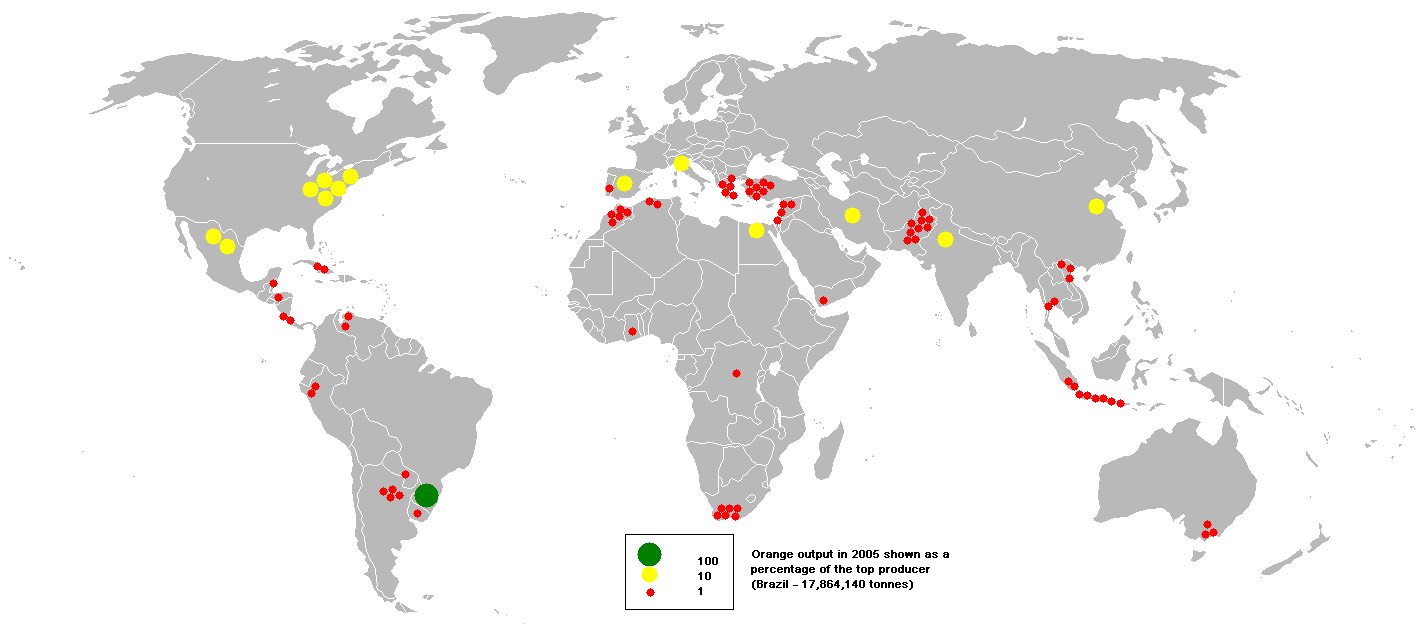
English: This bubble map shows the global distribution of orange output in 2005 as a percentage of the top producer (Brazil - 17,864,140 tonnes).
This map is consistent with incomplete set of data too as long as the top producer is known. It resolves the accessibility issues faced by colour-coded maps that may not be properly rendered in old computer screens. |
||
| Data | |||
| Font |
Data was extracted on 8th June 2007 from http://faostat.fao.org/site/336/DesktopDefault.aspx?PageID=336 Based on Image:BlankMap-World.png |
||
| Autor | en:user:Anwar saadat | ||
| Permís (Com reutilitzar aquest fitxer) |
|
Historial del fitxer
Cliqueu una data/hora per veure el fitxer tal com era aleshores.
| Data/hora | Miniatura | Dimensions | Usuari/a | Comentari | |
|---|---|---|---|---|---|
| actual | 21:24, 3 oct 2009 | | 1.425 × 625 (60 Ko) | Serg!o | {{Information |Description={{en|This bubble map shows the global distribution of orange output in 2005 as a percentage of the top producer (Brazil - 17,864,140 tonnes). This map is consistent with incomplete set of |
Ús del fitxer
La pàgina següent utilitza aquest fitxer:
Ús global del fitxer
Utilització d'aquest fitxer en altres wikis:
- Utilització a eo.wikipedia.org
- Utilització a es.wikipedia.org
- Utilització a ka.wikipedia.org
- Utilització a zh.wikipedia.org