
Fitxer:2005salt.PNG

Mida d'aquesta previsualització: 800 × 351 píxels. Altres resolucions: 320 × 140 píxels | 640 × 281 píxels | 1.425 × 625 píxels.
Fitxer original (1.425 × 625 píxels, mida del fitxer: 60 Ko, tipus MIME: image/png)
| Aquest fitxer i la informació mostrada a continuació provenen del dipòsit multimèdia lliure Wikimedia Commons. |
Resum
| Descripció |
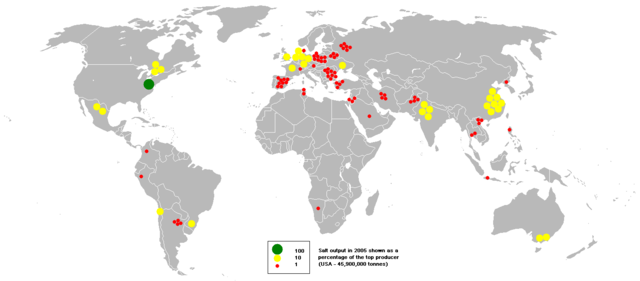
English: This bubble map shows the global distribution of (unrefined) salt output in 2005 as a percentage of the top producer (USA - 45,900,000 tonnes).
This map is consistent with an incomplete set of data too as long as the top producer is known. It resolves the accessibility issues faced by colour-coded maps that may not be properly rendered in old computer screens. Data was extracted on 1st June 2007. Source - http://www.bgs.ac.uk/mineralsuk/commodity/world/home.html Based on Image:BlankMap-World.png |
| Data | |
| Font | english Wikipedia |
| Autor | Anwar saadat |
Llicència
| Jo, el titular del copyright d'aquesta obra, l'allibero al domini públic. Això s'aplica a tot el món. En alguns països això pot no ser legalment possible, en tal cas: Jo faig concessió a tothom del dret d'usar aquesta obra per a qualsevol propòsit, sense cap condició llevat d'aquelles requerides per la llei. |
Historial del fitxer
Cliqueu una data/hora per veure el fitxer tal com era aleshores.
| Data/hora | Miniatura | Dimensions | Usuari/a | Comentari | |
|---|---|---|---|---|---|
| actual | 21:04, 13 oct 2008 | | 1.425 × 625 (60 Ko) | Tamorlan | {{Information |Description= {{en|This bubble map shows the global distribution of (unrefined) salt output in 2005 as a percentage of the top producer (USA - 45,900,000 tonnes). This map is consistent with an incomp |
Ús del fitxer
La pàgina següent utilitza aquest fitxer:
Ús global del fitxer
Utilització d'aquest fitxer en altres wikis:
- Utilització a ar.wikipedia.org
- Utilització a ast.wikipedia.org
- Utilització a bn.wikipedia.org
- Utilització a es.wikipedia.org
- Utilització a fa.wikipedia.org
- Utilització a gl.wikipedia.org
- Utilització a incubator.wikimedia.org
- Utilització a pt.wikipedia.org
- Utilització a ru.wikipedia.org
- Utilització a si.wikipedia.org
- Utilització a ta.wikipedia.org
- Utilització a te.wikipedia.org
- Utilització a ug.wikipedia.org
- Utilització a uk.wikipedia.org
- Utilització a ur.wikipedia.org
- Utilització a zh.wikipedia.org