
Fitxer:BAMS climate assess boulder water vapor 2002 - 2.png
No hi ha cap versió amb una resolució més gran.
BAMS_climate_assess_boulder_water_vapor_2002_-_2.png (775 × 425 píxels, mida del fitxer: 12 Ko, tipus MIME: image/png)
| Aquest fitxer i la informació mostrada a continuació provenen del dipòsit multimèdia lliure Wikimedia Commons. |
Resum
| Descripció |
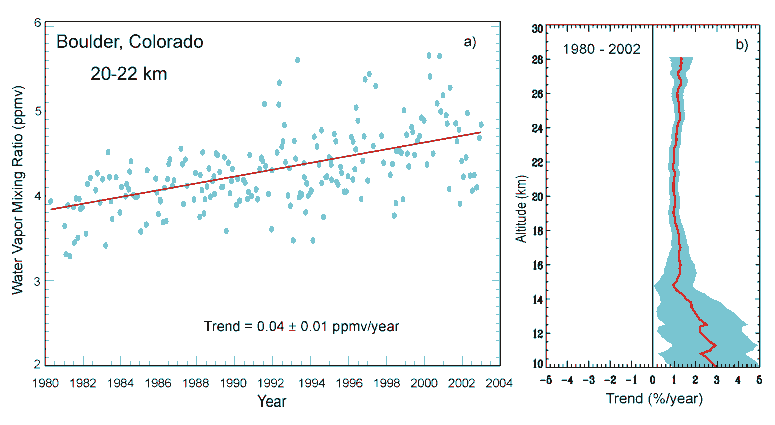
English: Stratospheric water vapor 1% increase. 30% may be due to increased methane.
|
||
| Font | http://www.cmdl.noaa.gov/hotitems/watervapor.html | ||
| Autor | NOAA |

Llicència
This image is in the public domain because it contains materials that originally came from the U.S. National Oceanic and Atmospheric Administration, taken or made as part of an employee's official duties.
|
Registre original de càrregues
| Data/hora | Dimensions | Usuari/a | Comentari |
|---|---|---|---|
| 5 de juliol de 2006, 13:42:17 | 775 × 425 (13969 bytes) | Nils Simon (discussió · contribucions) | {{PD-USGov-DOC-NOAA}} |
Historial del fitxer
Cliqueu una data/hora per veure el fitxer tal com era aleshores.
| Data/hora | Miniatura | Dimensions | Usuari/a | Comentari | |
|---|---|---|---|---|---|
| actual | 14:21, 21 ago 2014 | | 775 × 425 (12 Ko) | GifTagger | Bot: Converting file to superior PNG file. (Source: BAMS_climate_assess_boulder_water_vapor_2002.gif). This GIF was problematic due to non-greyscale color table. |
Ús del fitxer
La pàgina següent utilitza aquest fitxer:
Ús global del fitxer
Utilització d'aquest fitxer en altres wikis:
- Utilització a de.wikipedia.org
- Utilització a en.wikipedia.org
- Utilització a es.wikipedia.org
- Utilització a fa.wikipedia.org
- Utilització a gu.wikipedia.org
- Utilització a hi.wikipedia.org
- Utilització a hr.wikipedia.org
- Utilització a id.wikipedia.org
- Utilització a nl.wikipedia.org
- Utilització a nn.wikipedia.org
- Utilització a pl.wikipedia.org
- Utilització a sc.wikipedia.org
- Utilització a sh.wikipedia.org
- Utilització a sw.wikipedia.org
- Utilització a ta.wikipedia.org
- Utilització a zh.wikipedia.org