
Fitxer:Energyfig.png
No hi ha cap versió amb una resolució més gran.
Energyfig.png (506 × 554 píxels, mida del fitxer: 108 Ko, tipus MIME: image/png)
| Aquest fitxer i la informació mostrada a continuació provenen del dipòsit multimèdia lliure Wikimedia Commons. |
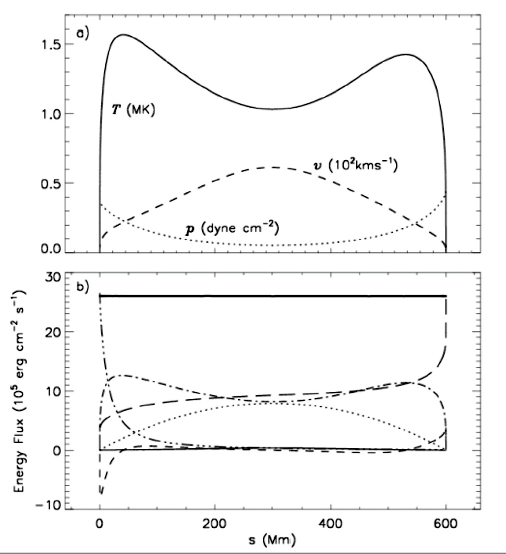
| Descripció | The above figure was produced by Dr Ian O'Neill and Dr Xing Li during research into the energy balance in a long coronal loop (600 million meters long in this example). This is a modelled coronal loop using a full-implicit, 2-fluid numerical method which solves the basic plasma equations simultaneously. In the figure, the top panel shows the plasma parameters along the coronal loop length, where plasma temperature (T in million Kelvin or 106K), velocity (v in 102 kilometers per second) and pressure (p in dyne per cm-2) are displayed. As can be seen, we are dealing with plasma temperatures of over 1.5MK. The lower panel demonstrates the energy sources (kinetic, gravity, enthalpy, wave fluxes) and energy sinks (conduction, radiation fluxes). With reference to the figure, the followeing energy flux corresponds to different traces on the graph: kinetic energy flux (thin solid line), gravitational flux (dotted), radiative flux (long-dash), conductive flux (short-dash), enthalpy flux (dot-dash), wave flux (triple-dot-dash) and the total flux (thick solid line). The total flux must remain constant to confirm steady state. |
| Font | English Wikipedia (here) |
| Autor | These results are published in: O'Neill, I. J. and X. Li, Coronal loops heated by turbulence-driven Alfvén waves: A two fluid model, A&A, 435, pages 1159-1167, 2005 (link to ADS). |
| |
Aquesta imatge ha estat, o ho és d'ara endavant, alliberada al domini públic pel seu autor, Eeron80 del projecte Wikimedia Commons. Això s'aplica a escala mundial. En cas que no sigui legalment possible: |
Historial del fitxer
Cliqueu una data/hora per veure el fitxer tal com era aleshores.
| Data/hora | Miniatura | Dimensions | Usuari/a | Comentari | |
|---|---|---|---|---|---|
| actual | 18:54, 29 abr 2008 | | 506 × 554 (108 Ko) | Henrykus | {{Information |Description=The above figure was produced by [http://www.astroengine.net/astro/projects.shtml Dr Ian O'Neill] and [http://users.aber.ac.uk/xxl Dr Xing Li] during research into the energy balance in a long coronal loop (600 million meters lo |
Ús del fitxer
La pàgina següent utilitza aquest fitxer:
Ús global del fitxer
Utilització d'aquest fitxer en altres wikis:
- Utilització a en.wikipedia.org
- Utilització a sr.wikipedia.org
- Utilització a tr.wikipedia.org
- Utilització a uk.wikipedia.org
- Utilització a zh.wikipedia.org