
Fitxer:Eu-estimation-tolerance-absolute.svg

Mida d'aquesta previsualització PNG del fitxer SVG: 300 × 300 píxels. Altres resolucions: 240 × 240 píxels | 480 × 480 píxels | 768 × 768 píxels | 1.024 × 1.024 píxels | 2.048 × 2.048 píxels.
Fitxer original (fitxer SVG, nominalment 300 × 300 píxels, mida del fitxer: 10 Ko)
| Aquest fitxer i la informació mostrada a continuació provenen del dipòsit multimèdia lliure Wikimedia Commons. |
Resum
| Descripció | |
| Data | |
| Font |
Self-made in gnuplot. |
| Autor | Nils R. Barth |
| Altres versions | File:Eu-estimation-tolerance-relative.svg (relative tolerances) |
gnuplot source
# Graphs of errors for the EU “estimated sign”
# Set terminal
set terminal svg enhanced size 300 300 fs 10
set samples 1001 # high quality
set border 31 linewidth .3 # thin border
unset key # no key
# Tolerable error function:
# input is nominal quantity
# output is tolerable negative error, as an absolute quantity
#
# e(x)/x is thus tolerable ~relative~ error
#
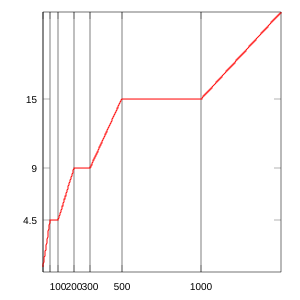
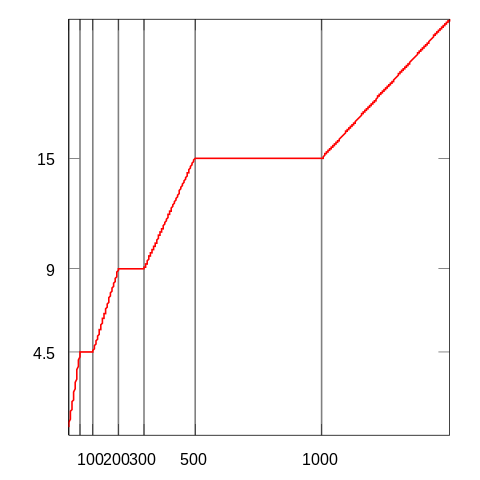
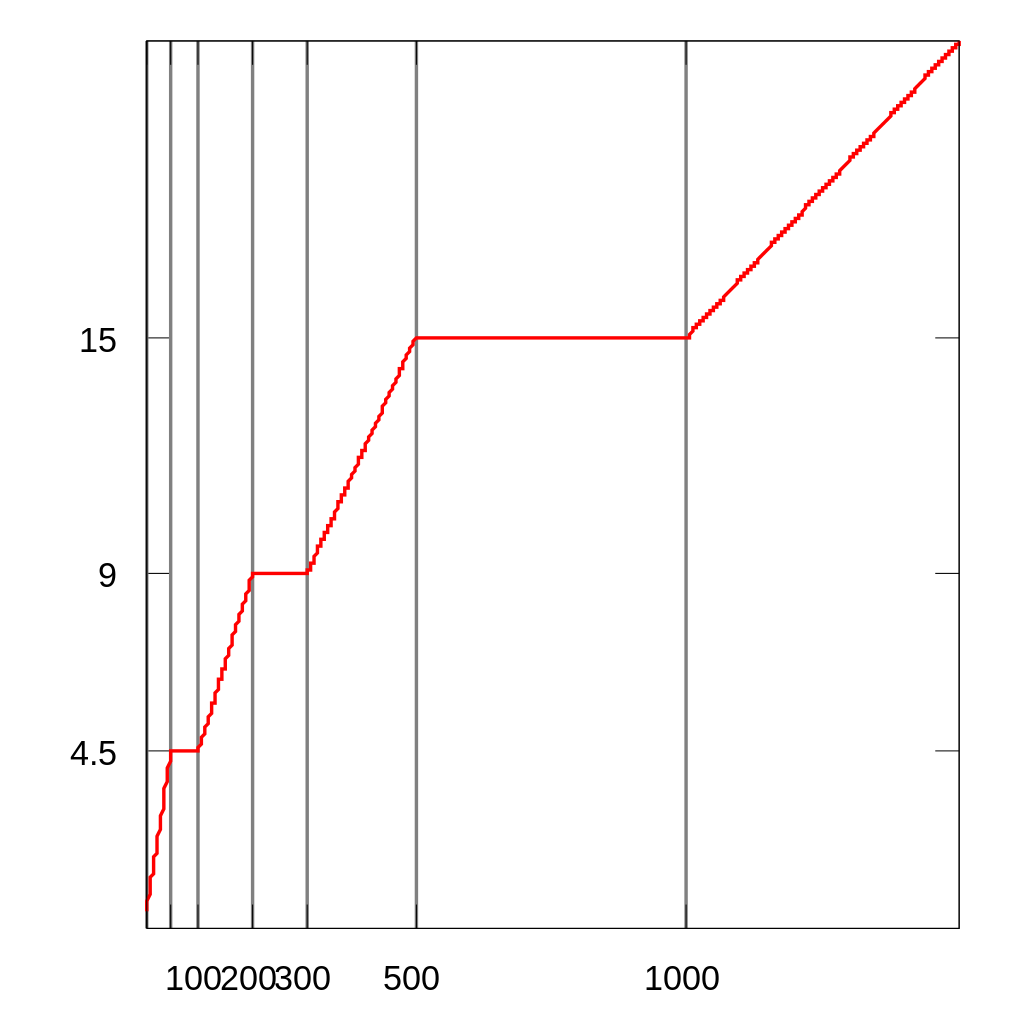
e(x) = x < 50 ? 9e-2 * x \
: x < 100 ? 4.5 \
: x < 200 ? 4.5e-2 * x \
: x < 300 ? 9 \
: x < 500 ? 3e-2 * x \
: x < 1000 ? 15 \
: 1.5e-2 * x
# X-range and x-tics
# Set x tics at the cutoff points
set xtics ("" 5, "" 50, "100" 100, "200" 200, "300" 300, "500" 500, "1000" 1000)
# Set representative x-range:
# undefined below 5, and
# extending above 1500 to 10,000 just shrinks the interesting part of the graph
#
# (A log-scale on the x-axis would fit everything in, but obscure the linearity
# in the absolute error; it would be ok in the relative error though.)
set xrange [5:1500]
# Draw the x grid, to show ranges
set grid x
####################
# Absolute error
####################
# Set y tics at the fixed amounts
set ytics (4.5,9,15)
# Set y-range to go from 0 to max (over this x-range)
set yrange [0:22.5]
set output "eu-estimation-tolerance-absolute.svg"
plot e(x)
####################
# Relative error
####################
# Set y-tics at the fixed percentages
set ytics (1.5, 3, 4.5, 9)
# Set y-range (0% – 10%) to include all percentages, with clearance for 9%.
set yrange [0:10]
set format y "%g %%" # Format as percentage
set output "eu-estimation-tolerance-relative.svg"
# Multiply by 100 so as a percentage
plot e(x)/x*100
Llicència
Nils R. Barth, el titular dels drets d'autor d'aquest treball, el public sota la següent llicència:
| Jo, el titular del copyright d'aquesta obra, l'allibero al domini públic. Això s'aplica a tot el món. En alguns països això pot no ser legalment possible, en tal cas: Jo faig concessió a tothom del dret d'usar aquesta obra per a qualsevol propòsit, sense cap condició llevat d'aquelles requerides per la llei. |
Historial del fitxer
Cliqueu una data/hora per veure el fitxer tal com era aleshores.
| Data/hora | Miniatura | Dimensions | Usuari/a | Comentari | |
|---|---|---|---|---|---|
| actual | 05:24, 25 març 2009 | | 300 × 300 (10 Ko) | Nbarth | Thinner border. |
| 05:09, 25 març 2009 |  | 300 × 300 (8 Ko) | Nbarth | Fix nominal size so agrees with target size (300, not 1000). | |
| 04:56, 25 març 2009 |  | 1.000 × 1.000 (13 Ko) | Nbarth | Smaller text to avoid collision | |
| 04:54, 25 març 2009 |  | 1.000 × 1.000 (13 Ko) | Nbarth | Thicker lines, bigger text | |
| 04:01, 25 març 2009 |  | 1.000 × 1.000 (14 Ko) | Nbarth | {{Information |Description={{en|1=Absolute estimation tolerances for the European Union estimated sign.}} |Source=Own work by uploader |Author=Nbarth |Date=2009-03-25 |Permission= |other_versio |
Ús del fitxer
La pàgina següent utilitza aquest fitxer:
Ús global del fitxer
Utilització d'aquest fitxer en altres wikis:
- Utilització a en.wikipedia.org
- Utilització a es.wikipedia.org
- Utilització a fa.wikipedia.org
- Utilització a ja.wikipedia.org