
Fitxer:South Africa 2011 Coloured population proportion map.svg

Mida d'aquesta previsualització PNG del fitxer SVG: 684 × 599 píxels. Altres resolucions: 274 × 240 píxels | 548 × 480 píxels | 876 × 768 píxels | 1.168 × 1.024 píxels | 2.337 × 2.048 píxels | 809 × 709 píxels.
Fitxer original (fitxer SVG, nominalment 809 × 709 píxels, mida del fitxer: 730 Ko)
| Aquest fitxer i la informació mostrada a continuació provenen del dipòsit multimèdia lliure Wikimedia Commons. |
Resum
| Descripció |
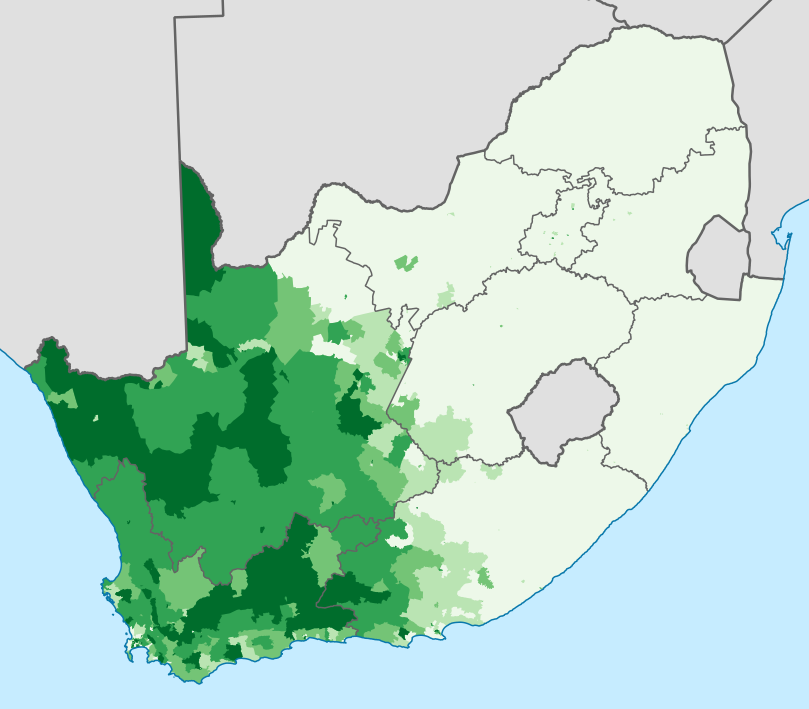
English: Map showing the proportion of the South African population that self-described as "Coloured" in the 2011 census, at electoral ward level.
0–20%
20–40%
40–60%
60–80%
80–100%
Projection is Albers Equal-Area Conic, with standard parallels at 25.5° S and 31.5° S, and origin at 28.5° S 25.5° E. |
| Data | |
| Font | Statistics South Africa's Census 2011 is the source of the basic population data. The map results from my own processing of the data. For ward boundaries see File:South Africa electoral wards 2011 blank.svg. |
| Autor | Htonl |
Llicència
The following license applies to the population data on which the map is based:

|
El titular dels drets d'autor d'aquest arxiu, Stats SA, permet que qualsevol pugui usar-lo per a qualsevol propòsit, sempre que el titular dels drets d'autor sigui reconegut correctament. La redistribució, les obres derivades, l'ús comercial, i qualsevol altre ús està permès. |
Reconeixement:
"the user acknowledges Stats SA as the source of the basic data wherever they process, apply, utilise, publish or distribute the data, and also that they specify that the relevant application and analysis (where applicable) result from their own processing of the data" [1]
|
The following tag applies to the map itself:
| Jo, el titular del copyright d'aquesta obra, l'allibero al domini públic. Això s'aplica a tot el món. En alguns països això pot no ser legalment possible, en tal cas: Jo faig concessió a tothom del dret d'usar aquesta obra per a qualsevol propòsit, sense cap condició llevat d'aquelles requerides per la llei. |
Historial del fitxer
Cliqueu una data/hora per veure el fitxer tal com era aleshores.
| Data/hora | Miniatura | Dimensions | Usuari/a | Comentari | |
|---|---|---|---|---|---|
| actual | 00:08, 17 abr 2013 | | 809 × 709 (730 Ko) | Htonl | == {{int:filedesc}} == {{Information |Description={{en|1=Map showing the proportion of the South African population that self-described as "Coloured" in the 2011 census, at electoral ward level. {{legend|#EDF8E9|0–20%}} {{legend|#BAE4B3|20–40%}} {{... |
Ús del fitxer
La pàgina següent utilitza aquest fitxer:
Ús global del fitxer
Utilització d'aquest fitxer en altres wikis:
- Utilització a af.wikipedia.org
- Utilització a cs.wikipedia.org
- Utilització a de.wikipedia.org
- Utilització a en.wikipedia.org
- Utilització a es.wikipedia.org
- Utilització a et.wikipedia.org
- Utilització a fr.wikipedia.org
- Utilització a id.wikipedia.org
- Utilització a ja.wikipedia.org
- Utilització a no.wikipedia.org
- Utilització a nso.wikipedia.org
- Utilització a pt.wikipedia.org
- Utilització a simple.wikipedia.org
- Utilització a sr.wikipedia.org
- Utilització a tn.wikipedia.org
- Utilització a uk.wikipedia.org
- Utilització a zh.wikipedia.org