Fitxer:Tautochrone curve.gif

El contingut de la pàgina no s'admet en altres llengües.
De la Viquipèdia, l'enciclopèdia lliure

Tautochrone_curve.gif(300 × 200 píxels, mida del fitxer: 102 Ko, tipus MIME: image/gif, en bucle, 80 fotogrames, 3,2 s)

Descripció a Commons

Resum

Descripció

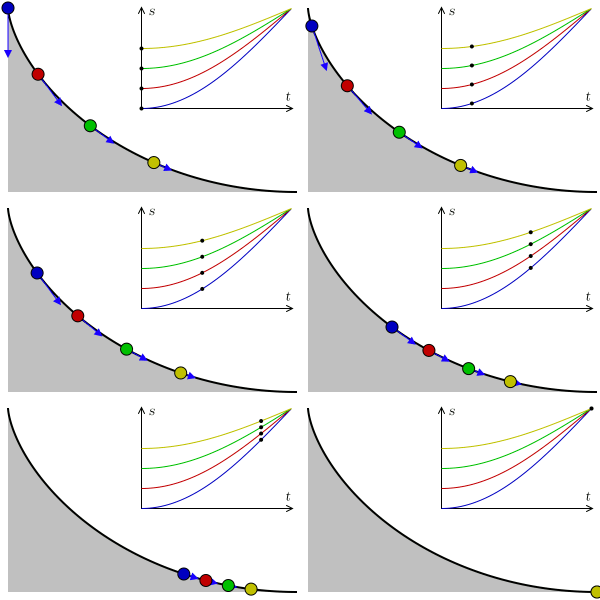
A tautochrone curve is the curve for which the time taken by an object sliding without friction in uniform gravity to its lowest point is independent of its starting point. Here, four points at different positions reach the bottom at the same time.


In the graphic, s represents arc length, t represents time, and the blue arrows represent acceleration along the trajectory. As the points reach the horizontal, the velocity becomes constant, the arc length being linear to time.
Data 9 de maig de 2007; new version agost de 2009
Font Treball propi
Autor

Claudio Rocchini

rewritten by Geek3
GIF genesis
InfoField
 
Aquesta GIF imatge rasteritzada ha estat creada amb Matplotlib
Codi font
InfoField

Python code

#!/usr/bin/python
# -*- coding: utf8 -*-

'''
animation of balls on a tautochrone curve
'''

import os
import numpy as np
import matplotlib.pyplot as plt
import matplotlib.patches as patches
from matplotlib import animation
from math import *

# settings
fname = 'Tautochrone curve'
width, height = 300, 200
nframes = 80
fps=25

balls = [
{'a':1.0, 'color':'#0000c0'},
{'a':0.8, 'color':'#c00000'},
{'a':0.6, 'color':'#00c000'},
{'a':0.4, 'color':'#c0c000'}]

def curve(phi):
    x = phi + sin(phi)
    y = 1.0 - cos(phi)
    return np.array([x, y])

def animate(nframe, empty=False):
    t = nframe / float(nframes - 1.)
    
    # prepare a clean and image-filling canvas for each frame
    fig = plt.gcf()
    fig.clf()
    ax_canvas = plt.gca()
    ax_canvas.set_position((0, 0, 1, 1))
    ax_canvas.set_xlim(0, width)
    ax_canvas.set_ylim(0, height)
    ax_canvas.axis('off')
    
    # draw the ramp
    x0, y0 = 293, 8
    h = 182
    npoints = 200
    points = []
    for i in range(npoints):
        phi = i / (npoints - 1.0) * pi - pi
        x, y = h/2. * curve(phi) + np.array([x0, y0])
        points.append([x, y])
    
    rampline = patches.Polygon(points, closed=False, facecolor='none',
                       edgecolor='black', linewidth=1.5, capstyle='butt')
    points += [[x0-h*pi/2, y0], [x0-h*pi/2, y0+h]]
    
    ramp = patches.Polygon(points, closed=True, facecolor='#c0c0c0', edgecolor='none')
    
    # plot axes
    plotw = 0.5
    ax_plot = fig.add_axes((0.47, 0.46, plotw, plotw*2/pi*width/height))
    ax_plot.set_xlim(0, 1)
    ax_plot.set_ylim(0, 1)
    for b in balls:
        time_array = np.linspace(0, 1, 201)
        phi_pendulum_array = (1 - b['a'] * np.cos(time_array*pi/2))
        ax_plot.plot(time_array, phi_pendulum_array, '-', color=b['color'], lw=.8)
    ax_plot.set_xticks([])
    ax_plot.set_yticks([])
    ax_plot.set_xlabel('t')
    ax_plot.set_ylabel('s')
    
    ax_canvas.add_patch(ramp)
    ax_canvas.add_patch(rampline)
    
    for b in balls:
        # draw the balls
        phi_pendulum = b['a'] * -cos(t * pi/2)
        phi_wheel = 2 * asin(phi_pendulum)
        phi_wheel = -abs(phi_wheel)
        x, y = h/2. * curve(phi_wheel) + np.array([x0, y0])
        ax_canvas.add_patch(patches.Circle((x, y), radius=6., zorder=3,
                            facecolor=b['color'], edgecolor='black'))
        ax_plot.plot([t], [1 + phi_pendulum], '.', ms=6., mec='none', mfc='black')
        
        v = h/2. * np.array([1 + cos(phi_wheel), sin(phi_wheel)])
        vnorm = v / hypot(v[0], v[1])
        # in the harmonic motion, acceleration is proportional to -position
        acc_along_line = 38. * -phi_pendulum * vnorm
        ax_canvas.arrow(x, y, acc_along_line[0], acc_along_line[1],
                 head_width=6, head_length=6, fc='#1b00ff', ec='#1b00ff')

fig = plt.figure(figsize=(width/100., height/100.))
print 'saving', fname + '.gif'
#anim = animation.FuncAnimation(fig, animate, frames=nframes)
#anim.save(fname + '.gif', writer='imagemagick', fps=fps)

frames = []
for nframe in range(nframes):
    frame = fname + '_{:02}.png'.format(nframe)
    animation.FuncAnimation(fig, lambda n: animate(nframe), frames=1).save(
        frame, writer='imagemagick')
    frames.append(frame)

# assemble animation using imagemagick, this avoids dithering and huge filesize
os.system('convert -delay {} +dither +remap -layers Optimize {} "{}"'.format(
    100//fps, ' '.join(['"' + f + '"' for f in frames]), fname + '.gif'))
for frame in frames:
    if os.path.exists(frame):
        os.remove(frame)

Llicència

Jo, el titular dels drets d'autor d'aquest treball, el public sota les següents llicències:
GNU head S'autoritza la còpia, la distribució i la modificació d'aquest document sota els termes de la llicència de documentació lliure GNU versió 1.2 o qualsevol altra versió posterior que publiqui la Free Software Foundation; sense seccions invariants, ni textos de portada, ni textos de contraportada. S'inclou una còpia d'aquesta llicència en la secció titulada GNU Free Documentation License.
w:ca:Creative Commons
reconeixement compartir igual
Aquest fitxer està subjecte a la llicència de Creative Commons Reconeixement i Compartir Igual 3.0 No adaptada.
Sou lliure de:
  • compartir – copiar, distribuir i comunicar públicament l'obra
  • adaptar – fer-ne obres derivades
Amb les condicions següents:
  • reconeixement – Heu de donar la informació adequada sobre l'autor, proporcionar un enllaç a la llicència i indicar si s'han realitzat canvis. Podeu fer-ho amb qualsevol mitjà raonable, però de cap manera no suggereixi que l'autor us dóna suport o aprova l'ús que en feu.
  • compartir igual – Si modifiqueu, transformeu, o generareu amb el material, haureu de distribuir les vostres contribucions sota una llicència similar o una de compatible com l'original
Aquest avís de llicència s'ha afegit a aquest fitxer d'acord amb l'actualització de la llicència GFDL.
w:ca:Creative Commons
reconeixement
Aquest fitxer està disponible sota la llicència Creative Commons Reconeixement 2.5 Genèrica.
Sou lliure de:
  • compartir – copiar, distribuir i comunicar públicament l'obra
  • adaptar – fer-ne obres derivades
Amb les condicions següents:
  • reconeixement – Heu de donar la informació adequada sobre l'autor, proporcionar un enllaç a la llicència i indicar si s'han realitzat canvis. Podeu fer-ho amb qualsevol mitjà raonable, però de cap manera no suggereixi que l'autor us dóna suport o aprova l'ús que en feu.
Podeu seleccionar la llicència que vulgueu.

Llegendes

Afegeix una explicació d'una línia del que representa aquest fitxer

Elements representats en aquest fitxer

representa l'entitat

Historial del fitxer

Cliqueu una data/hora per veure el fitxer tal com era aleshores.

Data/horaMiniaturaDimensionsUsuari/aComentari
actual15:15, 1 ago 2009Miniatura per a la versió del 15:15, 1 ago 2009300 × 200 (102 Ko)Geek3new physically correct version
08:56, 9 maig 2007Miniatura per a la versió del 08:56, 9 maig 2007300 × 200 (602 Ko)Rocchini{{Information |Description=Tautochrone curve animation (4 points runs over a cycloid) |Source=Own work |Date=2007-05-09 |Author=Claudio Rocchini |Permission=CC-BY 2.5 }}

La pàgina següent utilitza aquest fitxer:

Ús global del fitxer

Utilització d'aquest fitxer en altres wikis: