
Fitxer:Limpopo 2001 dominant language map.svg

Mida d'aquesta previsualització PNG del fitxer SVG: 800 × 530 píxels. Altres resolucions: 320 × 212 píxels | 640 × 424 píxels | 1.024 × 679 píxels | 1.280 × 848 píxels | 2.560 × 1.697 píxels | 1.228 × 814 píxels.
Fitxer original (fitxer SVG, nominalment 1.228 × 814 píxels, mida del fitxer: 812 Ko)
| Aquest fitxer i la informació mostrada a continuació provenen del dipòsit multimèdia lliure Wikimedia Commons. |
Resum
| Descripció |
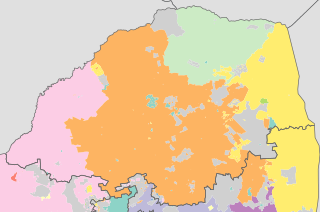
English: Map showing the dominant home languages in Limpopo province of South Africa, according to Census 2001 at the "Subplace" level. In this context, a language is dominant if it more than 50% of the population in an area speak it at home, or more than 33% speak it and no other language is spoken by more than 25%.
Afrikaans
English
isiNdebele
isiXhosa
isiZulu
Sesotho sa Leboa
Sesotho
Setswana
siSwati
Tshivenda
Xitsonga
No language dominant |
| Data | |
| Font | Statistics South Africa's Census 2001 is the source of the basic population data. The map results from my own processing of the data. |
| Autor | Htonl |
Llicència
The following license applies to the population data on which the map is based:

|
El titular dels drets d'autor d'aquest arxiu, Stats SA, permet que qualsevol pugui usar-lo per a qualsevol propòsit, sempre que el titular dels drets d'autor sigui reconegut correctament. La redistribució, les obres derivades, l'ús comercial, i qualsevol altre ús està permès. |
Reconeixement:
"the user acknowledges Stats SA as the source of the basic data wherever they process, apply, utilise, publish or distribute the data, and also that they specify that the relevant application and analysis (where applicable) result from their own processing of the data" [1]
|
The following tag applies to the map itself:
| Jo, el titular del copyright d'aquesta obra, l'allibero al domini públic. Això s'aplica a tot el món. En alguns països això pot no ser legalment possible, en tal cas: Jo faig concessió a tothom del dret d'usar aquesta obra per a qualsevol propòsit, sense cap condició llevat d'aquelles requerides per la llei. |
Historial del fitxer
Cliqueu una data/hora per veure el fitxer tal com era aleshores.
| Data/hora | Miniatura | Dimensions | Usuari/a | Comentari | |
|---|---|---|---|---|---|
| actual | 07:50, 5 oct 2010 | | 1.228 × 814 (812 Ko) | Htonl | equal-area projection, map styling |
| 13:08, 16 feb 2010 |  | 1.136 × 692 (1,67 Mo) | Htonl | size | |
| 22:25, 15 feb 2010 |  | 1.000 × 609 (1,77 Mo) | Htonl | tweak | |
| 22:19, 15 feb 2010 |  | 1.000 × 609 (1,77 Mo) | Htonl | fix errors | |
| 23:55, 10 feb 2010 |  | 1.000 × 609 (1,7 Mo) | Htonl | =={{int:filedesc}}== {{Information |Description={{en|1=Map showing the dominant home languages in Limpopo province of South Africa, according to Census 2001 at the "Subplace" level. In this context, a language is dominant if it more than 50% of the popula |
Ús del fitxer
La pàgina següent utilitza aquest fitxer:
Ús global del fitxer
Utilització d'aquest fitxer en altres wikis:
- Utilització a af.wikipedia.org
- Utilització a de.wikipedia.org
- Utilització a en.wikipedia.org
- Utilització a frr.wikipedia.org
- Utilització a he.wikipedia.org
- Utilització a hy.wikipedia.org
- Utilització a ja.wikipedia.org
- Utilització a ka.wikipedia.org
- Utilització a nl.wikipedia.org
- Utilització a nso.wikipedia.org
- Utilització a ru.wikipedia.org
- Utilització a zu.wikipedia.org