
Fitxer:2005ICT.PNG

Mida d'aquesta previsualització: 800 × 351 píxels. Altres resolucions: 320 × 140 píxels | 640 × 281 píxels | 1.425 × 625 píxels.
Fitxer original (1.425 × 625 píxels, mida del fitxer: 59 Ko, tipus MIME: image/png)
| Aquest fitxer i la informació mostrada a continuació provenen del dipòsit multimèdia lliure Wikimedia Commons. |
| Descripció |
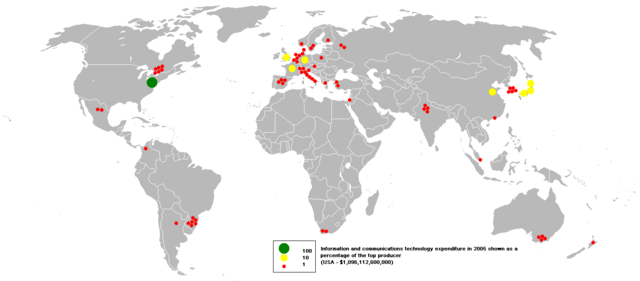
This bubble map shows the global distribution of spending on information and communication technologies in 2005 as a percentage of the top market (USA - $1,096,112,600,000). This map is consistent with incomplete set of data too as long as the top market is known. It resolves the accessibility issues faced by colour-coded maps that may not be properly rendered in old computer screens. Data was extracted on 4th July 2007 from http://siteresources.worldbank.org/DATASTATISTICS/Resources/table5_11.pdf Based on Image:BlankMap-World.png |
||
| Font | Originally uploaded at en wiki by User:Anwar saadat under PD-self licence | ||
| Autor | en:User:Anwar saadat | ||
| Permís (Com reutilitzar aquest fitxer) |
|

|
Aquesta imatge (de tipus economic map) s'hauria de tornar a crear utilitzant gràfics vectorials com ara un fitxer SVG. Això té diversos avantatges; en trobareu més informació a Commons:Media for cleanup. Si ja disposeu d'una versió d'aquesta imatge en format SVG, us preguem que la pengeu; després, reemplaceu aquesta plantilla amb la plantilla {{Vector version available|nom nou de la imatge.svg}} en aquesta imatge.
|
Historial del fitxer
Cliqueu una data/hora per veure el fitxer tal com era aleshores.
| Data/hora | Miniatura | Dimensions | Usuari/a | Comentari | |
|---|---|---|---|---|---|
| actual | 03:58, 27 oct 2007 | | 1.425 × 625 (59 Ko) | Shushruth | {{Description=This bubble map shows the global distribution of spending on information and communication technologies in 2005 as a percentage of the top market (USA - $1,096,112,600,000). This map is consistent with incomplete set of data too as long as |
Ús del fitxer
La pàgina següent utilitza aquest fitxer:
Ús global del fitxer
Utilització d'aquest fitxer en altres wikis:
- Utilització a an.wikipedia.org
- Utilització a ar.wikipedia.org
- Utilització a as.wikipedia.org
- Utilització a ba.wikipedia.org
- Utilització a be-tarask.wikipedia.org
- Utilització a es.wikipedia.org
- Utilització a gl.wikipedia.org
- Utilització a hi.wikipedia.org
- Utilització a id.wikipedia.org
- Utilització a jv.wikipedia.org
- Utilització a ka.wikipedia.org
- Utilització a kk.wikipedia.org
- Utilització a kn.wikipedia.org
- Utilització a la.wikipedia.org
- Utilització a mhr.wikipedia.org
- Utilització a min.wikipedia.org
- Utilització a mk.wikipedia.org
- Utilització a mwl.wikipedia.org
- Utilització a my.wikipedia.org
- Utilització a ro.wikipedia.org
- Utilització a ru.wikipedia.org
- Utilització a si.wikipedia.org
- Utilització a sk.wikipedia.org
- Utilització a so.wikipedia.org
- Utilització a sw.wikipedia.org
- Utilització a tn.wikipedia.org
- Utilització a vi.wikipedia.org
- Utilització a zh.wikipedia.org