
Fitxer:Holocene Sea Level-fr.svg

Mida d'aquesta previsualització PNG del fitxer SVG: 512 × 364 píxels. Altres resolucions: 320 × 228 píxels | 640 × 455 píxels | 1.024 × 728 píxels | 1.280 × 910 píxels | 2.560 × 1.820 píxels.
Fitxer original (fitxer SVG, nominalment 512 × 364 píxels, mida del fitxer: 25 Ko)
| Aquest fitxer i la informació mostrada a continuació provenen del dipòsit multimèdia lliure Wikimedia Commons. |
| Descripció |
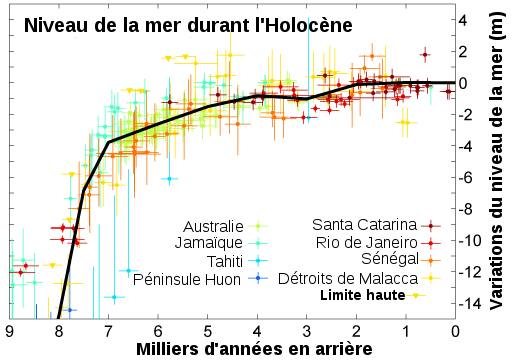
 English: This figure shows changes in sea level during the Holocene, the time following the end of the most recent glacial period, based on data from Fleming et al. 1998, Fleming 2000, & Milne et al. 2005. These papers collected data from various reports and adjusted them for subsequent vertical geologic motions, primarily those associated with post-glacial continental and hydroisostatic rebound. The first refers to deformations caused by the weight of continental ice sheets pressing down on the land, the latter refers to uplift in coastal areas resulting from the increased weight of water associated with rising sea levels. It should be noted that because of the latter effect and associated uplift, many islands, especially in the Pacific, exhibited higher local sea levels in the mid Holocene than they do today. Uncertainty about the magnitude of these corrections is the dominant uncertainty in many measurements of Holocene scale sea level change.
The black curve is based on minimizing the sum of squares error weighted distance between this curve and the plotted data. It was constructed by adjusting a number of specified tie points, typically placed every 1 kyr and forced to go to 0 at the modern day. A small number of extreme outliers were dropped. It should be noted that some authors propose the existence of significant short-term fluctuations in sea level such that the sea level curve might oscillate up and down about this ~1 kyr mean state. Others dispute this and argue that sea level change has been a smooth and gradual process for essentially the entire length of the Holocene. Regardless of such putative fluctuations, evidence such as presented by Morhange et al. (2001) suggests that in the last 10 kyr sea level has never been higher than it is at present. |
||||||||
| Data | |||||||||
| Font | Image:Holocene Sea Level.png by Robert A. Rohde. This figure was prepared by Robert A. Rohde from published data, and is incorporated into the Global Warming Art project. Translation in french and conversion to svg was done by SuperManu | ||||||||
| Autor | Robert A. Rohde, translated by SuperManu | ||||||||
| Permís (Com reutilitzar aquest fitxer) |
Image from Global Warming Art
This image is an original work created for Global Warming Art. Please refer to the image description page for more information.
|
||||||||
| Altres versions |
[]
|


References
- Fleming, Kevin, Paul Johnston, Dan Zwartz, Yusuke Yokoyama, Kurt Lambeck and John Chappell (1998). "Refining the eustatic sea-level curve since the Last Glacial Maximum using far- and intermediate-field sites". Earth and Planetary Science Letters 163 (1-4): 327-342. doi:10.1016/S0012-821X(98)00198-8
- Fleming, Kevin Michael (2000) Glacial Rebound and Sea-level Change Constraints on the Greenland Ice Sheet, Australian National University PhD Thesis
- Milne, Glenn A., Antony J. Long and Sophie E. Bassett (2005). "Modelling Holocene relative sea-level observations from the Caribbean and South America". Quaternary Science Reviews 24 (10-11): 1183-1202. doi:10.1016/j.quascirev.2004.10.005
- Morhange, C., J. Laborel, A. Hesnard (2001). "Changes of relative sea level during the past 5000 years in the ancient harbor of Marseilles, Southern France". Palaeogeography, Palaeoclimatology, Palaeoecology 166: 319-329.
Aquesta imatge vectorial ha estat creada amb Inkscape .

|
Aquest fitxer SVG inclou text encapsulat que es pot traduir al vostre idioma utilitzant un editor que admeti SVG, un editor de text o l'eina de traducció de SVG. Per a més informació vegeu l'ajuda de traducció de fitxers SVG. |
Historial del fitxer
Cliqueu una data/hora per veure el fitxer tal com era aleshores.
| Data/hora | Miniatura | Dimensions | Usuari/a | Comentari | |
|---|---|---|---|---|---|
| actual | 11:34, 30 oct 2007 | | 512 × 364 (25 Ko) | Emmanuel.boutet | {{Information |Description= {{en|This figure shows changes in sea level during the Holocene, the time following the end of the most recent glacial period, based on data from Fleming et al. 1998, Fleming 2000, |
Ús del fitxer
No hi ha pàgines que utilitzin aquest fitxer.
Ús global del fitxer
Utilització d'aquest fitxer en altres wikis:
- Utilització a fr.wikipedia.org