Fitxer:Partial transmittance.gif

El contingut de la pàgina no s'admet en altres llengües.
De la Viquipèdia, l'enciclopèdia lliure

Partial_transmittance.gif(367 × 161 píxels, mida del fitxer: 67 Ko, tipus MIME: image/gif, en bucle, 53 fotogrames, 4,2 s)

Descripció a Commons

Resum

Descripció
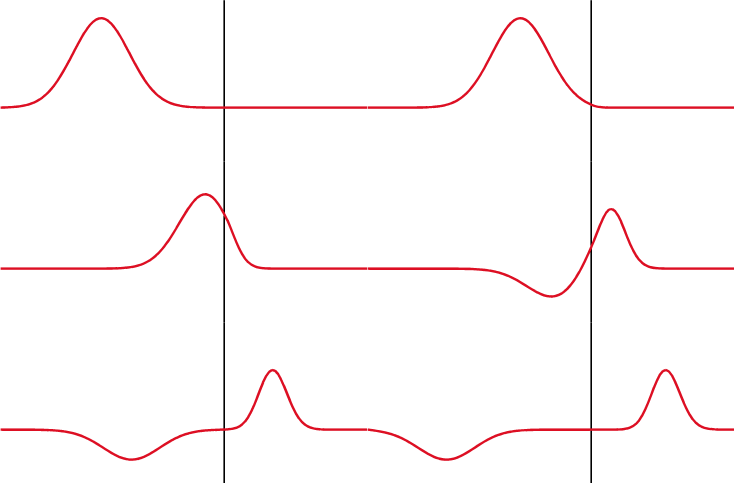
Русский: Показано классическое отражение/прохождение солитона гауссового импульса от/в более плотную среду. В реальности же, свет отражается не от поверхности, а от всех частиц тела (см. ru:КЭД).
English: Illustration of partial reflection of a wave. A gaussian wave on a one-dimensional string strikes a boundary with transmission coefficient of 0.5. Half the wave is transmitted and half is reflected.
Français : Illustration de la réflection partielle d'une onde. Une onde gaussienne se déplaçant sur un ressort unidimensionnel est réfléchie/transmise au niveau d'une interface avec un coefficient de transmission de 0.5.
Español: Ilustración de una reflexión parcial de una onda. Una onda gaussiana sobre una cuerda de una dimensión choca contra un limite con un coeficiente de transmisión de 0.5. La mitad de la onda es transmitida y la otra mitad es reflejada.
Data
Font self-made with MATLAB, source code below
Autor Oleg Alexandrov
 
Aquesta GIF imatge rasteritzada ha estat creada amb MATLAB.

Llicència

Public domain Jo, el titular del copyright d'aquesta obra, l'allibero al domini públic. Això s'aplica a tot el món.
En alguns països això pot no ser legalment possible, en tal cas:
Jo faig concessió a tothom del dret d'usar aquesta obra per a qualsevol propòsit, sense cap condició llevat d'aquelles requerides per la llei.

MATLAB source code

% Partial transmittance and reflectance of a wave
% Code is messed up, don't have time to clean it now
function main()
 
   % KSmrq's colors
   red    = [0.867 0.06 0.14];
   blue   = [0, 129, 205]/256;
   green  = [0, 200,  70]/256;
   yellow = [254, 194,   0]/256;
   white = 0.99*[1, 1, 1];
   black = [0, 0, 0];
 
   % length of the string and the grid
   L = 5;
   N = 151;
   X=linspace(0, L, N);
 
   h = X(2)-X(1); % space grid size
   c = 0.01; % speed of the wave
   tau = 0.25*h/c; % time grid size
 
   % form a medium with a discontinuous wave speed
   C = 0*X+c;
 
   D=L/2;
   c_right = 0.5*c; % speed to the right of the disc
   for i=1:N
      if X(i) > D
         C(i) = c_right;
      end
   end
   % Now C = c for x < D, and C=c_right for x > D
 
   K = 5; % steepness of the bump
   S = 0; % shift the wave
   f=inline('exp(-K*(x-S).^2)', 'x', 'S', 'K'); % a gaussian as an initial wave
   df=inline('-2*K*(x-S).*exp(-K*(x-S).^2)', 'x', 'S', 'K'); % derivative of f
 
   % wave at time 0 and tau
   U0 = 0*f(X, S, K);
   U1 = U0 - 2*tau*c*df(X, S, K);
 
   U = 0*U0; % current U
 
   % plot between Start and End
   Start=130; End=500;
 
   % hack to capture the first period of the wave
   min_k = 2*N; k_old = min_k; turn_on = 0; 
 
   frame_no = 0;
   for j=1:End
 
      %  fixed end points
      U(1)=0; U(N)=0;
 
      % finite difference discretization in time
      for i=2:(N-1)
         U(i) = (C(i)*tau/h)^2*(U1(i+1)-2*U1(i)+U1(i-1)) + 2*U1(i) - U0(i);
      end
 
      % update info, for the next iteration
      U0 = U1; U1 = U;
 
      spacing=7;
 
     % plot the wave
      if rem(j, spacing) == 1 & j > Start
 
         figure(1); clf; hold on;
         axis equal; axis off; 
         lw = 3; % linewidth
 
         % size of the window
         ys = 1.2;
 
         low = -0.5*ys;
         high = ys;
         plot([D, D], [low, high], 'color', black, 'linewidth', 0.7*lw)
%         fill([X(1), D, D, X(1)], [low, low, high, high], [0.9, 1, 1], 'edgealpha', 0);
%         fill([D X(N), X(N), D],  [low, low, high, high], [1, 1, 1], 'edgealpha', 0);
 
         plot(X, U, 'color', red, 'linewidth', lw);
 
         % plot the ends of the string
         small_rad = 0.06;
 
         axis([-small_rad, 0.82*L, -ys, ys]);
 
         % small markers to keep the bounding box fixed when saving to eps
         plot(-small_rad, ys, '*', 'color', white);
         plot(L+small_rad, -ys, '*', 'color', white);
 
         pause(0.1)
         frame_no = frame_no + 1;
         %frame=sprintf('Frame%d.eps', 1000+frame_no); saveas(gcf, frame, 'psc2');
         frame=sprintf('Frame%d.png', 1000+frame_no);% saveas(gcf, frame);
         disp(frame)
         print (frame, '-dpng', '-r300');
 
      end
   end
 
 
% The gif image was creating with the command
% convert -antialias -loop 10000  -delay 8 -compress LZW -scale 20% Frame10*png Partial_transmittance.gif
% and was later cropped in Gimp

Llegendes

Afegeix una explicació d'una línia del que representa aquest fitxer

Elements representats en aquest fitxer

representa l'entitat

Historial del fitxer

Cliqueu una data/hora per veure el fitxer tal com era aleshores.

Data/horaMiniaturaDimensionsUsuari/aComentari
actual18:36, 9 abr 2010Miniatura per a la versió del 18:36, 9 abr 2010367 × 161 (67 Ko)Aiyizooptimized animation
07:56, 26 nov 2007Miniatura per a la versió del 07:56, 26 nov 2007367 × 161 (86 Ko)Oleg Alexandrov{{Information |Description=Illustration of en:Transmission coefficient (optics) |Source=self-made with MATLAB, source code below |Date=~~~~~ |Author= Oleg Alexandrov |Permission=PD-self, see below |other_versions= }} {{PD-se

Ús global del fitxer

Utilització d'aquest fitxer en altres wikis:

Vegeu més usos globals d'aquest fitxer.