
Fitxer:Polar Bear Habitat.png

Fitxer original (981 × 879 píxels, mida del fitxer: 605 Ko, tipus MIME: image/png)
| Aquest fitxer i la informació mostrada a continuació provenen del dipòsit multimèdia lliure Wikimedia Commons. |
Resum
| Descripció |
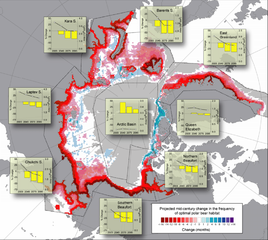
Projected changes (based on 10 IPCC AR-4 GCM models run with the SRES- A1B forcing scenario) in the spatial distribution and integrated annual area of optimal polar bear habitat. Base map shows the cumulative number of months per decade where optimal polar bear habitat was either lost (red) or gained (blue) from 2001–2010 to 2041–2050. Offshore gray shading denotes areas where optimal habitat was absent in both periods. Insets show the average annual ( 12 months) cumulative area of optimal habitat (right y-axis, line plot) for four 10-year periods in the 21st century (x-axis midpoints), and their associated percent change in area (left y axis, histograms) relative to the first decade (2001–2010). |
| Font | Predicting The Future Distribution of Polar Bear Habitat in the Polar Basin from Resource Selection Functions Applied to 21st Century General Circulation Model Projections of Sea Ice |
| Autor | USGS |
Llicència
Aquesta obra és en el domini públic als Estats Units perquè és una obra del govern federal dels Estats Units sota els termes del Títol 17, Capítol 1, Secció 105 del Codi dels EUA. Vegeu drets d'autor.
Nota: Això només s'aplica a obres del Govern Federal i no a les dels estats individuals ni cap altra subdivisió administrativa. Aquesta plantilla tampoc no s'aplica a dissenys de segells de correus publicats pel Servei Postal dels Estats Units des de 1978 (vegeu 206.02(b) of Compendium II: Copyright Office Practices).
|
 | |
| Aquest fitxer està identificat com a lliure de restriccions conegudes sota la llei de drets d'autor, inclosos els drets veïns. | ||
Historial del fitxer
Cliqueu una data/hora per veure el fitxer tal com era aleshores.
| Data/hora | Miniatura | Dimensions | Usuari/a | Comentari | |
|---|---|---|---|---|---|
| actual | 18:54, 24 nov 2010 | | 981 × 879 (605 Ko) | PawełS | Bigger resolution. Screenshot of PDF in bigger zoom. |
| 00:46, 1 des 2007 |  | 610 × 546 (423 Ko) | Sagredo | {{Information |Description=Projected changes (based on 10 IPCC AR-4 GCM models run with the SRES- A1B forcing scenario) in the spatial distribution and integrated annual area of optimal polar bear habitat. Base map shows the cumulative number of months |
Ús del fitxer
La pàgina següent utilitza aquest fitxer:
Ús global del fitxer
Utilització d'aquest fitxer en altres wikis:
- Utilització a ar.wikipedia.org
- Utilització a cs.wikipedia.org
- Utilització a de.wikipedia.org
- Utilització a en.wikipedia.org
- Utilització a eo.wikipedia.org
- Utilització a es.wikipedia.org
- Utilització a fr.wikipedia.org
- Utilització a gl.wikipedia.org
- Utilització a gu.wikipedia.org
- Utilització a hi.wikipedia.org
- Utilització a kn.wikipedia.org
- Utilització a pt.wikipedia.org
- Utilització a si.wikipedia.org
- Utilització a vi.wikipedia.org
- Utilització a zh.wikipedia.org