
Fitxer:RiemannCriticalLine.svg

Mida d'aquesta previsualització PNG del fitxer SVG: 800 × 372 píxels. Altres resolucions: 320 × 149 píxels | 640 × 298 píxels | 1.024 × 476 píxels | 1.280 × 595 píxels | 2.560 × 1.191 píxels | 933 × 434 píxels.
Fitxer original (fitxer SVG, nominalment 933 × 434 píxels, mida del fitxer: 50 Ko)
| Aquest fitxer i la informació mostrada a continuació provenen del dipòsit multimèdia lliure Wikimedia Commons. |
W3C-validity not checked.
Resum
| Descripció |
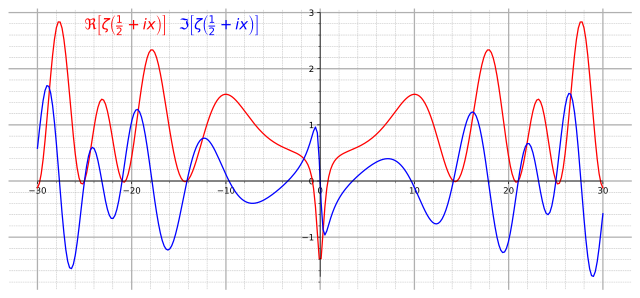
English: Graph of real (red) and imaginary (blue) parts of the critical line Re(z)=1/2 of the Riemann zeta function. |
||
| Data | |||
| Font |
Own work. Made with Mathematica using the following code: Show[Plot[{Re[Zeta[1/2+I x]], Im[Zeta[1/2+I x]]}, {x,-30, 30},AxesLabel->{"x"} , PlotStyle->{Red, Blue}, Ticks->{Table[4x-28,{x,0,14}]}, ImageSize->{800,600}],
Graphics[Text[Style[\[DoubleStruckCapitalR][\[Zeta][ I x + "1/2"]],14,Red ,Background ->White],{-22,2.6} ]],
Graphics[Text[Style[\[GothicCapitalI][\[Zeta][ I x + "1/2"]],14,Blue ,Background ->White],{-14,2.6} ]]] |
||
| Autor | Slonzor | ||
| Permís (Com reutilitzar aquest fitxer) |
Public Domain | ||
| SVG genesis | |||
| Codi font | Python code
|
Llicència
| Jo, el titular del copyright d'aquesta obra, l'allibero al domini públic. Això s'aplica a tot el món. En alguns països això pot no ser legalment possible, en tal cas: Jo faig concessió a tothom del dret d'usar aquesta obra per a qualsevol propòsit, sense cap condició llevat d'aquelles requerides per la llei. |
Historial del fitxer
Cliqueu una data/hora per veure el fitxer tal com era aleshores.
| Data/hora | Miniatura | Dimensions | Usuari/a | Comentari | |
|---|---|---|---|---|---|
| actual | 22:01, 23 ago 2017 | | 933 × 434 (50 Ko) | Krishnavedala | much reduced vector version |
| 00:28, 25 set 2009 |  | 800 × 600 (122 Ko) | Geek3 | linewidth=1px | |
| 21:33, 20 nov 2008 |  | 800 × 600 (122 Ko) | Slonzor | Man i've messed this up a lot of times. | |
| 21:27, 20 nov 2008 |  | 800 × 600 (3,36 Mo) | Slonzor | ||
| 21:23, 20 nov 2008 |  | 800 × 600 (3,36 Mo) | Slonzor | ||
| 21:18, 20 nov 2008 |  | 800 × 600 (3,36 Mo) | Slonzor | ||
| 21:13, 20 nov 2008 |  | 800 × 600 (79 Ko) | Slonzor | {{Information |Description={{en|1=Graph of real (red) and imaginary (blue) parts of the critical line Re(z)=1/2 of the Riemann zeta function.}} |Source=Own work. Made with Mathematica using the following code: <code><nowiki>Show[Plot[{Re[Zeta[1/2+I x]], |
Ús del fitxer
La pàgina següent utilitza aquest fitxer:
Ús global del fitxer
Utilització d'aquest fitxer en altres wikis:
- Utilització a ar.wikipedia.org
- Utilització a ba.wikipedia.org
- Utilització a be.wikipedia.org
- Utilització a ckb.wikipedia.org
- Utilització a da.wikipedia.org
- Utilització a el.wikipedia.org
- Utilització a en.wikipedia.org
- Utilització a eo.wikipedia.org
- Utilització a eu.wikipedia.org
- Utilització a fa.wikipedia.org
- Utilització a fi.wikipedia.org
- Utilització a he.wikipedia.org
- Utilització a hi.wikipedia.org
- Utilització a hy.wikipedia.org
- Utilització a id.wikipedia.org
- Utilització a it.wikipedia.org
- Utilització a it.wikiquote.org
- Utilització a ja.wikipedia.org
- Utilització a ko.wikipedia.org
- Utilització a la.wikipedia.org
- Utilització a mn.wikipedia.org
- Utilització a nn.wikipedia.org
- Utilització a no.wikipedia.org
- Utilització a pa.wikipedia.org
- Utilització a pt.wikipedia.org
- Utilització a ru.wikipedia.org
- Utilització a sl.wikipedia.org
- Utilització a sq.wikipedia.org
- Utilització a sr.wikipedia.org
- Utilització a uk.wikipedia.org
- Utilització a vi.wikipedia.org
- Utilització a zh-yue.wikipedia.org
- Utilització a zh.wikipedia.org
Vegeu més usos globals d'aquest fitxer.