
Fitxer:Satellite Temperatures.png

Mida d'aquesta previsualització: 800 × 530 píxels. Altres resolucions: 320 × 212 píxels | 640 × 424 píxels | 1.024 × 678 píxels | 1.280 × 848 píxels | 2.400 × 1.590 píxels.
Fitxer original (2.400 × 1.590 píxels, mida del fitxer: 297 Ko, tipus MIME: image/png)
| Aquest fitxer i la informació mostrada a continuació provenen del dipòsit multimèdia lliure Wikimedia Commons. |
| Descripció |
 
|
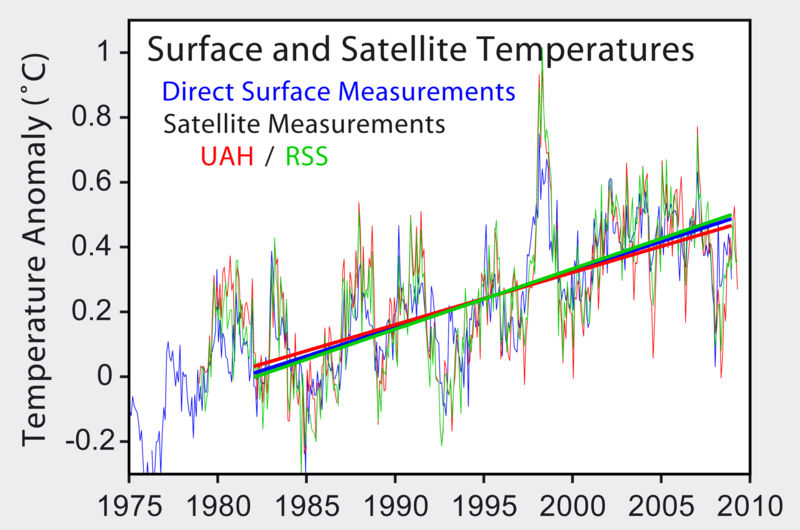
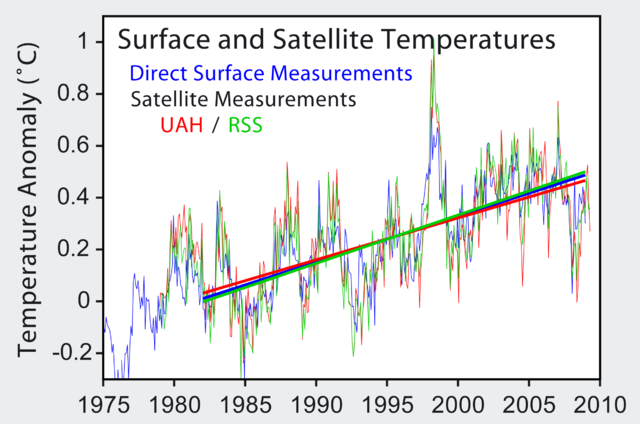
| Font | http://www.cru.uea.ac.uk/cru/data/temperature/ |
| Autor | Robert A. Rohde |
Resum ==
Image from Global Warming Art
This image is an original work created for Global Warming Art. Please refer to the image description page for more information.

|
S'autoritza la còpia, la distribució i la modificació d'aquest document sota els termes de la llicència de documentació lliure GNU versió 1.2 o qualsevol altra versió posterior que publiqui la Free Software Foundation; sense seccions invariants, ni textos de portada, ni textos de contraportada. S'inclou una còpia d'aquesta llicència en la secció titulada GNU Free Documentation License. |
| Aquest fitxer està subjecte a la llicència de Creative Commons Reconeixement i Compartir Igual 3.0 No adaptada. | ||
| ||
| Aquest avís de llicència s'ha afegit a aquest fitxer d'acord amb l'actualització de la llicència GFDL. |
Historial del fitxer
Cliqueu una data/hora per veure el fitxer tal com era aleshores.
| Data/hora | Miniatura | Dimensions | Usuari/a | Comentari | |
|---|---|---|---|---|---|
| actual | 22:30, 31 jul 2009 | | 2.400 × 1.590 (297 Ko) | Dragons flight | update |
| 09:10, 10 abr 2006 |  | 512 × 363 (30 Ko) | Pflatau |
Ús del fitxer
La pàgina següent utilitza aquest fitxer:
Ús global del fitxer
Utilització d'aquest fitxer en altres wikis:
- Utilització a de.wikipedia.org
- Utilització a en.wikipedia.org
- Satellite temperature measurement
- Leipzig Declaration
- User:Dragons flight/Images
- Temperature measurement
- User:C-randles
- Friends of Science
- Talk:Friends of Science
- User:Debnigo
- User:Merlinme/Sandbox
- Microwave Sounding Unit temperature measurements
- Wikipedia:Reference desk/Archives/Science/2011 June 13
- User talk:Sailsbystars/Archive 2
- Utilització a es.wikipedia.org
- Utilització a fa.wikipedia.org
- Utilització a fr.wikipedia.org
- Utilització a ko.wikipedia.org
- Utilització a pl.wikipedia.org
- Utilització a pt.wikipedia.org