Vés al contingut

Fitxer:3 phase rectification 2.svg
El contingut de la pàgina no s'admet en altres llengües.
De la Viquipèdia, l'enciclopèdia lliure

Fitxer original(fitxer SVG, nominalment 624 × 943 píxels, mida del fitxer: 120 Ko)

Descripció a Commons

Resum

Descripció
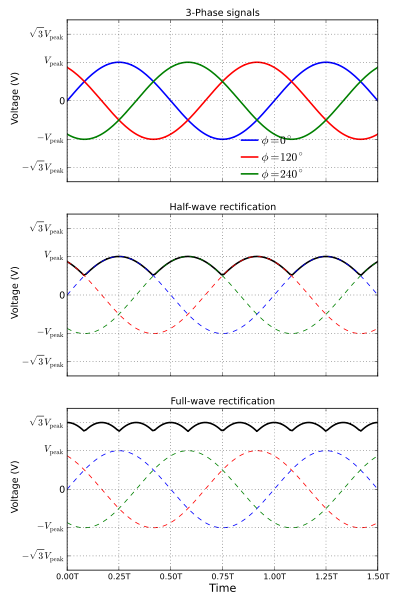
English: Waveforms for a typical 3-phase half-wave and full-wave rectifiers. The top plot shows the individual three phase signals, the middle plot shows the half-wave rectifier output in solid curve and the bottom plot shows the full-wave rectifier output in solid curve. The 'T' in time is the time period of individual signals and is the amplitude of each of the three input signals. The diagram was created using python, matplotlib and numpy.
Русский: Формы сигналов трёхфазного одно- и двухполупериодного выпрямителей. Сверху - отдельные трехфазные сигналы, средний график - выход однополупериодного выпрямителя сплошной линией, нижний график - выходной сигнал двухполупериодного выпрямителя сплошной линией. T - период, U - напряжения.
Data
Font Treball propi
Autor Krishnavedala
Altres versions

3 phase rectification 2.png [modifica]


.svg:

.png:

.jpg:

SVG genesis
InfoField
 
El codi font d'aquest SVG és vàlid.
 
Aquesta imatge vectorial ha estat creada amb Matplotlib
Codi font
InfoField

Python code

Source code
from matplotlib.pyplot import *
from numpy import *

f, Vpeak, cycles = 50., 1., 1.5
fs, Tlim = 2.*f, cycles/f
Vavg, Vrms = Vpeak*2./pi, Vpeak/sqrt(2.)
t = linspace(0,Tlim,fs*cycles)
w = 2.*pi*f # 50Hz AC
signal = lambda x,p: sin(w*x+p*2.*pi/3.)
def halfWave(time):
        s1, s2, s3 = signal(time,0.), signal(time,1.), signal(time,2.)
        if s1 > s2 and s1 > s3:
                if s2 > s3:
                        return s1, s2
                else:
                        return s1, s3
        elif s2 > s1 and s2 > s3:
                if s1 > s3:
                        return s2, s1
                else:
                        return s2, s3
        else:
                if s1 > s2:
                        return s3, s1
                else:
                        return s3, s2
 
def fullWave(time):
        s1, s2, s3 = abs(signal(time,0.)), abs(signal(time,1.)), \
                abs(signal(time,2.))
        if s1 > s2 and s1 > s3:
                if s2 > s3:
                        return s1, s2
                else:
                        return s1, s3
        elif s2 > s1 and s2 > s3:
                if s1 > s3:
                        return s2, s1
                else:
                        return s2, s3
        else:
                if s1 > s2:
                        return s3, s1
                else:
                        return s3, s2

xTickPts = []
for time in t:
        s1, s2, s3 = abs(signal(time,0.)), abs(signal(time,1.)), \
                abs(signal(time,2.))
        if s1 == s2:
                xTickPts = append(xTickPts, time)
                print time
        elif s2 == s3:
                xTickPts = append(xTickPts, time)
                print time
        elif s3 == s1:
                xTickPts = append(xTickPts, time)
                print time
 
def myAxes(this):
        this.grid(True)
        this.set_xlim(0,Tlim)
        this.set_xticks(arange(0,cycles+.25,.25)/f)
        this.set_xticklabels([])
        this.set_ylabel(r"Voltage (V)",fontsize=12)
	this.set_ylim(-2.*Vpeak-.1,2.*Vpeak+.1)
	this.set_yticks([-1.73*Vpeak,-Vpeak,0,Vpeak,1.73*Vpeak])
	this.set_yticklabels([r"$-\sqrt{3}V_{\mathrm{peak} }$",r"$-V_{\mathrm{peak} }$",\
        	r"0",r"$V_{\mathrm{peak} }$",r"$\sqrt{3}V_{\mathrm{peak} }$"])

fig = figure(figsize=(7,12))
ax = fig.add_subplot(311)
ax.plot(t,signal(t,0),'b',linewidth=2,label=r"$\phi=0^\circ$")
ax.plot(t,signal(t,1),'r',linewidth=2,label=r"$\phi=120^\circ$")
ax.plot(t,signal(t,2),'g',linewidth=2,label=r"$\phi=240^\circ$")
myAxes(ax)
ax.set_title(r'3-Phase signals',fontsize=12)
ax.legend(loc=1, \
        bbox_to_anchor=(.8,.35),\
        frameon=False,handletextpad=.05)

ax = fig.add_subplot(312)
S, H = [], []
for time in t:
        s, h = halfWave(time)
        S = append(S,s)
        H = append(H,h)
ax.plot(t,S,'k',linewidth=2.)
ax.plot(t,signal(t,0),'b--',linewidth=1.)
ax.plot(t,signal(t,1),'r--',linewidth=1.)
ax.plot(t,signal(t,2),'g--',linewidth=1.)
myAxes(ax)
ax.set_title(r"Half-wave rectification", fontsize=12) 
 
ax = fig.add_subplot(313)
S, H = [], []
for time in t:
        s, h = fullWave(time)
        S = append(S,s)
        H = append(H,h)
ax.plot(t,S+H,'k',linewidth=2.)
ax.plot(t,(signal(t,0)),'b--',linewidth=1.)
ax.plot(t,(signal(t,1)),'r--',linewidth=1.)
ax.plot(t,(signal(t,2)),'g--',linewidth=1.)
myAxes(ax)
ax.set_title(r"Full-wave rectification", fontsize=12) 
 
myLabel = []
for i in arange(0,cycles+.25,.25):
   myLabel = append(myLabel,r"%.2fT"%i)
#    myLabel = append(myLabel,r"${}^{%.1fT}_{\pi/%.1f}$"%(i,(i*2)))
 
ax.set_xticklabels(myLabel,fontsize=10)
ax.set_xlabel(r"Time",fontsize=14)
 
#fig.suptitle("3-phase AC rectification",fontsize=16)
 
fig.savefig("3_phase_rectification_2.svg",bbox_inches="tight",\
        pad_inches=.15)

Llicència

Jo, el titular dels drets d'autor d'aquest treball, el public sota les següents llicències:
w:ca:Creative Commons
reconeixement compartir igual
Aquest fitxer està subjecte a la llicència de Creative Commons Reconeixement i Compartir Igual 3.0 No adaptada.
Sou lliure de:
  • compartir – copiar, distribuir i comunicar públicament l'obra
  • adaptar – fer-ne obres derivades
Amb les condicions següents:
  • reconeixement – Heu de donar la informació adequada sobre l'autor, proporcionar un enllaç a la llicència i indicar si s'han realitzat canvis. Podeu fer-ho amb qualsevol mitjà raonable, però de cap manera no suggereixi que l'autor us dóna suport o aprova l'ús que en feu.
  • compartir igual – Si modifiqueu, transformeu, o generareu amb el material, haureu de distribuir les vostres contribucions sota una llicència similar o una de compatible com l'original
GNU head S'autoritza la còpia, la distribució i la modificació d'aquest document sota els termes de la llicència de documentació lliure GNU versió 1.2 o qualsevol altra versió posterior que publiqui la Free Software Foundation; sense seccions invariants, ni textos de portada, ni textos de contraportada. S'inclou una còpia d'aquesta llicència en la secció titulada GNU Free Documentation License.
Podeu seleccionar la llicència que vulgueu.

Llegendes

Afegeix una explicació d'una línia del que representa aquest fitxer

Elements representats en aquest fitxer

representa l'entitat

122.572 byte

943 píxel

624 píxel

Historial del fitxer

Cliqueu una data/hora per veure el fitxer tal com era aleshores.

(les més noves | les més antigues) Mostra (10 posteriors | ) (10 | 20 | 50 | 100 | 250 | 500)
Data/horaMiniaturaDimensionsUsuari/aComentari
actual17:52, 23 set 2011Miniatura per a la versió del 17:52, 23 set 2011624 × 943 (120 Ko)Krishnavedalaindividual plots are now consistent with each other
19:24, 22 set 2011Miniatura per a la versió del 19:24, 22 set 2011624 × 943 (114 Ko)Krishnavedalafinal correction, hopefully!!
19:20, 22 set 2011Miniatura per a la versió del 19:20, 22 set 2011640 × 943 (116 Ko)Krishnavedalacorrected Time coordinates
19:04, 22 set 2011Miniatura per a la versió del 19:04, 22 set 2011623 × 943 (115 Ko)KrishnavedalaCorrected the waveforms for the full wave rectification.
00:06, 1 jul 2011Miniatura per a la versió del 00:06, 1 jul 2011599 × 944 (175 Ko)SpinningsparkFixed correct use of italics. Fixed annotation outside boundary of image. Output waveform on top of input waveforms.
21:29, 30 juny 2011Miniatura per a la versió del 21:29, 30 juny 2011599 × 944 (111 Ko)Krishnavedalaremoved "(sec)" from the x-axis label
21:27, 30 juny 2011Miniatura per a la versió del 21:27, 30 juny 2011599 × 946 (111 Ko)Krishnavedalaedits from suggestions in here
21:51, 17 juny 2011Miniatura per a la versió del 21:51, 17 juny 2011524 × 874 (142 Ko)Krishnavedalathinner dashed lines
21:48, 17 juny 2011Miniatura per a la versió del 21:48, 17 juny 2011524 × 874 (142 Ko)Krishnavedalaall plots on the same scale to avoid confusion
19:18, 8 juny 2011Miniatura per a la versió del 19:18, 8 juny 2011594 × 946 (223 Ko)Krishnavedalacorrection in the labels
(les més noves | les més antigues) Mostra (10 posteriors | ) (10 | 20 | 50 | 100 | 250 | 500)

La pàgina següent utilitza aquest fitxer:

Ús global del fitxer

Utilització d'aquest fitxer en altres wikis: