
Fitxer:Earth's Heat Accumulation.png

Fitxer original (954 × 672 píxels, mida del fitxer: 144 Ko, tipus MIME: image/png)
| Aquest fitxer i la informació mostrada a continuació provenen del dipòsit multimèdia lliure Wikimedia Commons. |
Resum
| Descripció |
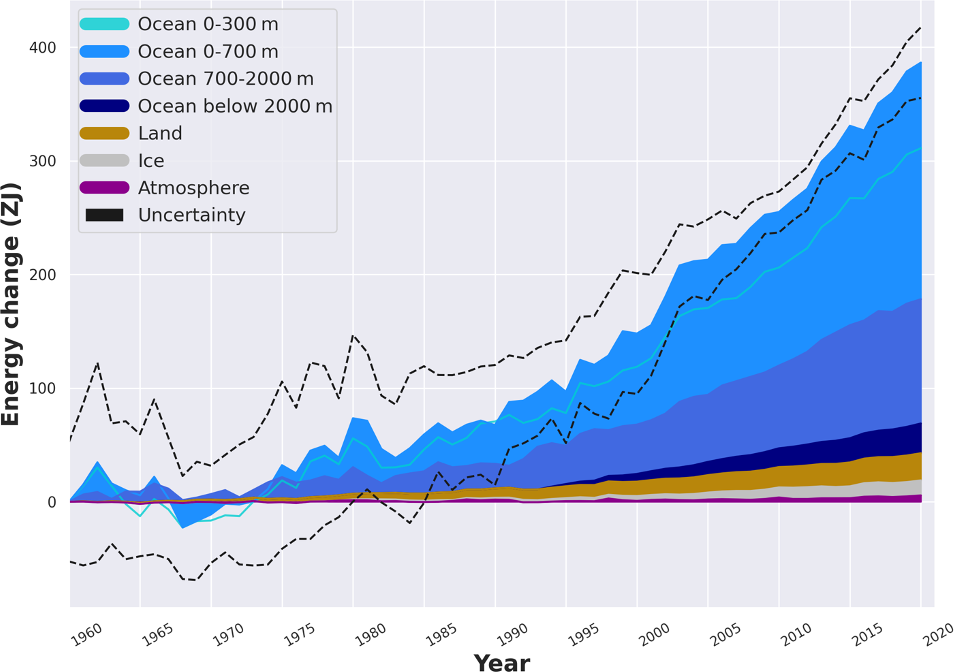
English: This graph shows the buildup of excess heat (thermal energy) in the ocean, land, ice, and atmospheric components of the Earth system since year 1960. The energy change is evaluated as ZettaJoules (=1021 Joules). The heat propagation to greater ocean depths with time is evident. Dashed lines bracket the total uncertainty of the data from the four components. Red line compares the trend of CERES satellite-based observations of the energy flow imbalance at top of atmosphere (TOA). Credits: |
| Data | |
| Font | https://essd.copernicus.org/articles/15/1675/2023/essd-15-1675-2023-f08.png |
| Autor | Karina von Schuckmann, et al. |
Llicència
- Sou lliure de:
- compartir – copiar, distribuir i comunicar públicament l'obra
- adaptar – fer-ne obres derivades
- Amb les condicions següents:
- reconeixement – Heu de donar la informació adequada sobre l'autor, proporcionar un enllaç a la llicència i indicar si s'han realitzat canvis. Podeu fer-ho amb qualsevol mitjà raonable, però de cap manera no suggereixi que l'autor us dóna suport o aprova l'ús que en feu.
- compartir igual – Si modifiqueu, transformeu, o generareu amb el material, haureu de distribuir les vostres contribucions sota una llicència similar o una de compatible com l'original
Historial del fitxer
Cliqueu una data/hora per veure el fitxer tal com era aleshores.
| Data/hora | Miniatura | Dimensions | Usuari/a | Comentari | |
|---|---|---|---|---|---|
| actual | 16:10, 9 maig 2023 | | 954 × 672 (144 Ko) | Bikesrcool | updated version from von Schuckmann, et al. (2023) CCA4.0 https://essd.copernicus.org/articles/15/1675/2023/ |
| 05:16, 10 nov 2021 |  | 2.067 × 1.489 (133 Ko) | Bikesrcool | Uploaded a work by Karina von Schuckman, LiJing Cheng, Matthew D. Palmer, James Hansen, Caterina Tassone, et. al. from https://essd.copernicus.org/articles/12/2013/2020/essd-12-2013-2020-f06-high-res.png with UploadWizard |
Ús del fitxer
La pàgina següent utilitza aquest fitxer:
Ús global del fitxer
Utilització d'aquest fitxer en altres wikis:
- Utilització a cs.wikipedia.org
- Utilització a en.wikipedia.org
- Utilització a es.wikipedia.org
- Utilització a fr.wikipedia.org
- Utilització a he.wikipedia.org
- Utilització a ig.wikipedia.org
- Utilització a ku.wikipedia.org
- Utilització a mk.wikipedia.org
- Utilització a zh.wikipedia.org