
Fitxer:High plains fresh groundwater usage 2000.svg

Fitxer original (fitxer SVG, nominalment 747 × 946 píxels, mida del fitxer: 1,48 Mo)
| Aquest fitxer i la informació mostrada a continuació provenen del dipòsit multimèdia lliure Wikimedia Commons. |
Resum
| Descripció |
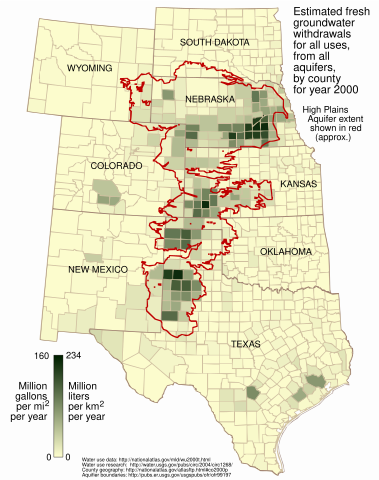
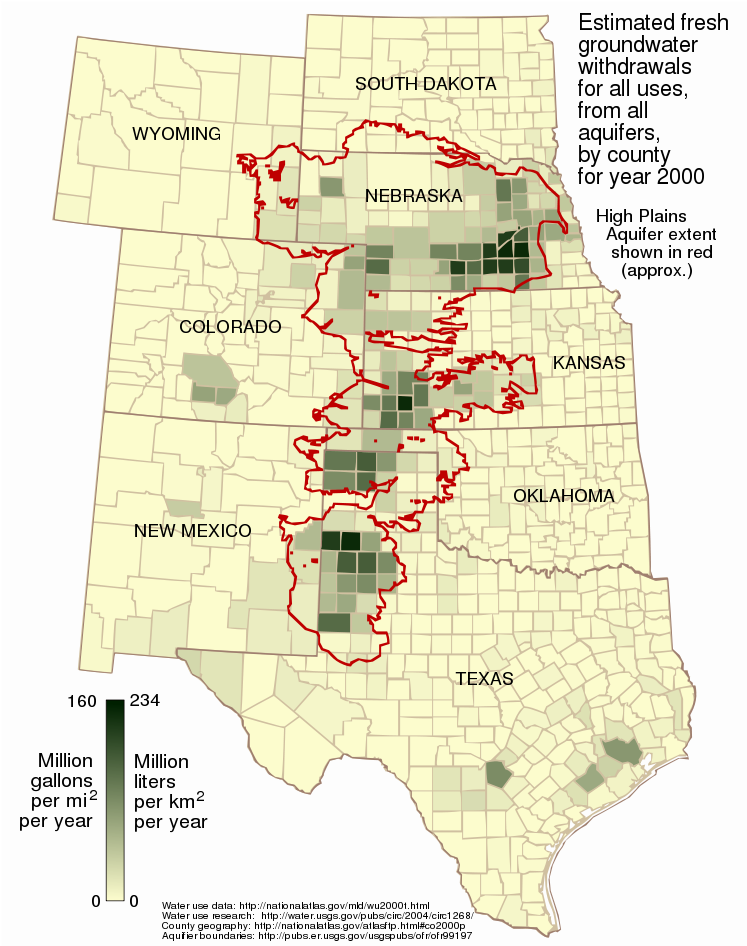
English: This map shows the estimated fresh water usage per square mile in the year 2000 for counties in the eight states underlain in part by the High Plains (Ogallala) Aquifer, presented as million gallons per square mile and million liters per square kilometer.
Usage is for all purposes -- public supply, industrial, irrigation, mining, livestock, and thermoelectric power -- from all underground sources, not just from the Ogallala Aquifer. Water usage data for the year 2000 was taken from the datafile wu2000t.dbf[1] from the US National Atlas[2]. Citation information from the metadata for that file:
Additionally:
The attribute used in this map is described:
The data is supplied as million gallons per day, by county. To arrive at an annual amount per square mile per year, the usage value from wu2000t.dbf was multiplied by 365 and divided by the number of square miles in the county as given in the 2000 county shapefile co2000p020 from the National Atlas:
Aquifer boundaries taken from Fischer and McGuire[3]. The map is presented in a Lambert azimuthal equal-area projection as used in the National Atlas (EPSG:2163[4]), the central meridian and latitude of which align nicely with the aquifer. |
| Data | |
| Font | Treball propi |
| Autor | Kbh3rd |
| Altres versions | File:Ogallala area freshwater ground withdrawals all aquifers.png |
Llicència
- Sou lliure de:
- compartir – copiar, distribuir i comunicar públicament l'obra
- adaptar – fer-ne obres derivades
- Amb les condicions següents:
- reconeixement – Heu de donar la informació adequada sobre l'autor, proporcionar un enllaç a la llicència i indicar si s'han realitzat canvis. Podeu fer-ho amb qualsevol mitjà raonable, però de cap manera no suggereixi que l'autor us dóna suport o aprova l'ús que en feu.
- compartir igual – Si modifiqueu, transformeu, o generareu amb el material, haureu de distribuir les vostres contribucions sota una llicència similar o una de compatible com l'original
Historial del fitxer
Cliqueu una data/hora per veure el fitxer tal com era aleshores.
| Data/hora | Miniatura | Dimensions | Usuari/a | Comentari | |
|---|---|---|---|---|---|
| actual | 01:13, 10 març 2009 | | 747 × 946 (1,48 Mo) | Kbh3rd | corrected metric conversion - see talk |
| 03:28, 3 març 2009 |  | 747 × 946 (1,48 Mo) | Kbh3rd | The map said "acre" while the data, as noted on the image description page, correctly said "square mile". I have fixed that and made some minor esthetic adjustments of the state name locations. | |
| 01:40, 3 març 2009 |  | 747 × 946 (1,48 Mo) | Kbh3rd | {{Information |Description={{en|1=This map shows the estimated fresh water usage per square mile in the year 2000 for counties in the eight states underlain in part by the High Plains (Ogallala) Aquifer, presented as million milli |
Ús del fitxer
Les 2 pàgines següents utilitzen aquest fitxer:
Ús global del fitxer
Utilització d'aquest fitxer en altres wikis:
- Utilització a ar.wikipedia.org
- Utilització a ckb.wikipedia.org
- Utilització a en.wikipedia.org
- Utilització a fy.wikipedia.org
- Utilització a kk.wikipedia.org
- Utilització a kw.wikipedia.org
- Utilització a ml.wikipedia.org
- Utilització a pt.wikipedia.org
- Utilització a sr.wikipedia.org
- Utilització a vi.wikipedia.org
- Utilització a www.wikidata.org
- Utilització a zh.wikipedia.org