
Fitxer:LogisticMap BifurcationDiagram.png

Mida d'aquesta previsualització: 800 × 566 píxels. Altres resolucions: 320 × 226 píxels | 640 × 453 píxels | 1.024 × 724 píxels | 1.280 × 905 píxels | 1.838 × 1.300 píxels.
Fitxer original (1.838 × 1.300 píxels, mida del fitxer: 571 Ko, tipus MIME: image/png)
| Aquest fitxer i la informació mostrada a continuació provenen del dipòsit multimèdia lliure Wikimedia Commons. |
Resum
| Descripció |
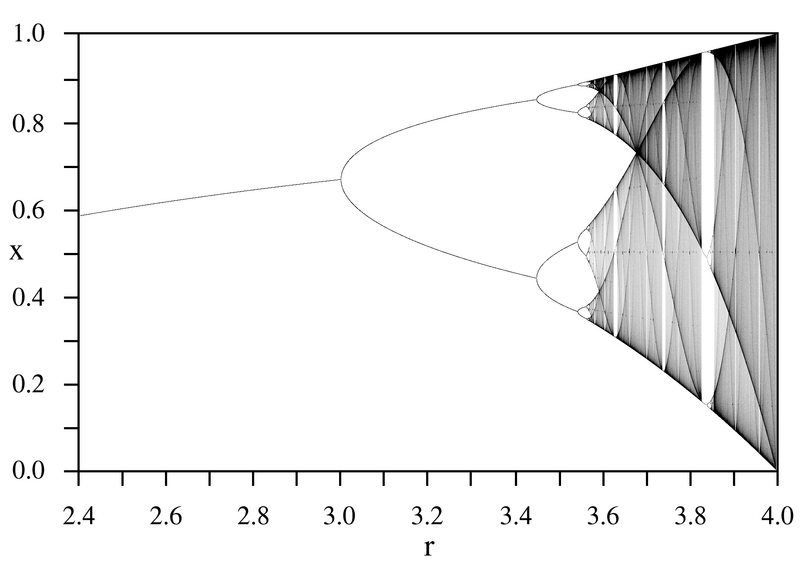
English: A bifurcation diagram for the Logistic map:
|
| Data | |
| Font | Treball propi |
| Autor | PAR |

Llicència
| Jo, el titular del copyright d'aquesta obra, l'allibero al domini públic. Això s'aplica a tot el món. En alguns països això pot no ser legalment possible, en tal cas: Jo faig concessió a tothom del dret d'usar aquesta obra per a qualsevol propòsit, sense cap condició llevat d'aquelles requerides per la llei. |

|
Aquesta imatge s'hauria de tornar a crear utilitzant gràfics vectorials com ara un fitxer SVG. Això té diversos avantatges; en trobareu més informació a Commons:Media for cleanup. Si ja disposeu d'una versió d'aquesta imatge en format SVG, us preguem que la pengeu; després, reemplaceu aquesta plantilla amb la plantilla {{Vector version available|nom nou de la imatge.svg}} en aquesta imatge.
|
Historial del fitxer
Cliqueu una data/hora per veure el fitxer tal com era aleshores.
| Data/hora | Miniatura | Dimensions | Usuari/a | Comentari | |
|---|---|---|---|---|---|
| actual | 02:11, 14 set 2005 | | 1.838 × 1.300 (571 Ko) | PAR~commonswiki | Bifurcation diagram for the logistic map for parameter r=2.4 to 4.0. |
Ús del fitxer
Les 3 pàgines següents utilitzen aquest fitxer:
Ús global del fitxer
Utilització d'aquest fitxer en altres wikis:
- Utilització a ar.wikipedia.org
- Utilització a da.wikipedia.org
- Utilització a de.wikipedia.org
- Utilització a el.wikipedia.org
- Utilització a en.wikipedia.org
- Talk:Bifurcation diagram
- Talk:Logistic map
- Mitchell Feigenbaum
- Portal:Mathematics/Featured picture archive
- Recurrence quantification analysis
- Portal:Mathematics/Suggestions
- Wikipedia:WikiProject Systems/List of images of systems
- User:Kiefer.Wolfowitz
- Wikipedia talk:WikiProject Mathematics/Archive/2011
- Ivar Ekeland
- Wikipedia talk:WikiProject Mathematics/Archive/2011/Apr
- User talk:Kiefer.Wolfowitz/Archive 9
- Portal:Mathematics/Featured picture/2011 12
- User:RazrRekr201/Table of constants
- Mathematical constant
- Utilització a en.wikibooks.org
- Utilització a en.wikiversity.org
- Utilització a eo.wikipedia.org
- Utilització a es.wikipedia.org
- Utilització a fi.wikipedia.org
- Utilització a fr.wikipedia.org
- Utilització a fr.wikiversity.org
- Utilització a he.wikipedia.org
- Utilització a hi.wikipedia.org
- Utilització a it.wikipedia.org
Vegeu més usos globals d'aquest fitxer.