Fitxer:Piecewise constant.svg
Aparença

Mida d'aquesta previsualització PNG del fitxer SVG: 600 × 480 píxels. Altres resolucions: 300 × 240 píxels | 960 × 768 píxels | 1.280 × 1.024 píxels | 2.560 × 2.048 píxels.
Fitxer original (fitxer SVG, nominalment 600 × 480 píxels, mida del fitxer: 5 Ko)
Historial del fitxer
Cliqueu una data/hora per veure el fitxer tal com era aleshores.
| Data/hora | Miniatura | Dimensions | Usuari/a | Comentari | |
|---|---|---|---|---|---|
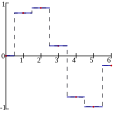
| actual | 18:00, 23 juny 2007 |  | 600 × 480 (5 Ko) | Berland | == Summary == {{Information |Description=Illustration of constant interpolation, more precisely en:Nearest neighbor interpolation on the same dataset as listed in Interpolation. |Source=self-made in Gnuplot |Dat |
| 17:55, 23 juny 2007 |  | 429 × 425 (16 Ko) | Cronholm144 | made svg |
Ús del fitxer
La pàgina següent utilitza aquest fitxer:
Ús global del fitxer
Utilització d'aquest fitxer en altres wikis:
- Utilització a ar.wikipedia.org
- Utilització a bs.wikipedia.org
- Utilització a de.wikipedia.org
- Utilització a en.wikipedia.org
- Utilització a et.wikipedia.org
- Utilització a fi.wikipedia.org
- Utilització a fr.wikipedia.org
- Utilització a hr.wikipedia.org
- Utilització a ja.wikipedia.org
- Utilització a mn.wikipedia.org
- Utilització a no.wikipedia.org
- Utilització a pt.wikipedia.org
- Utilització a ru.wikipedia.org
- Utilització a simple.wikipedia.org
- Utilització a sq.wikipedia.org
- Utilització a ta.wikipedia.org
- Utilització a uk.wikipedia.org
- Utilització a ur.wikipedia.org
- Utilització a zh.wikipedia.org

