
Fitxer:Hilbert transform.png
Fitxer original (1.600 × 1.120 píxels, mida del fitxer: 120 Ko, tipus MIME: image/png)
| Aquest fitxer i la informació mostrada a continuació provenen del dipòsit multimèdia lliure Wikimedia Commons. |
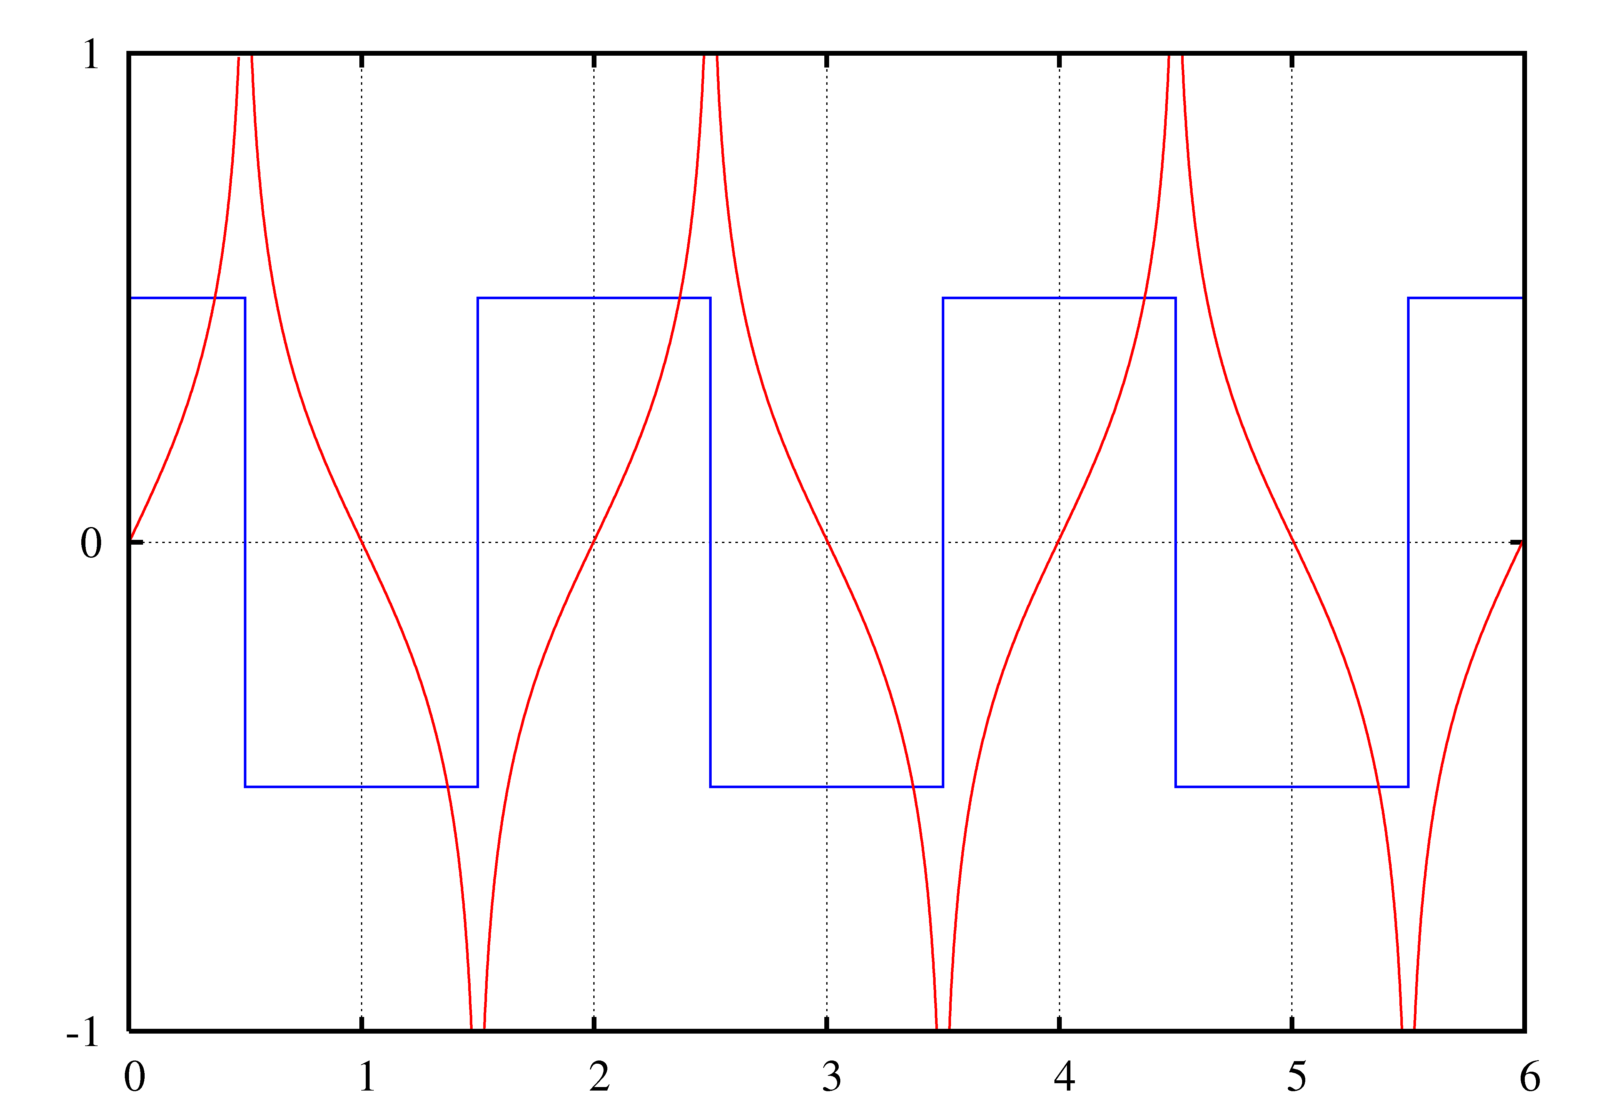
A graph of the Hilbert transform (red) of a square wave (blue).

|
File:Hilbert transform.svg és una versió vectorial (SVG) d'aquest fitxer. En cas de ser millor, hauria de ser emprada en lloc d'aquesta imatge tramada.
File:Hilbert transform.png → File:Hilbert transform.svg
Per a més informació pel que fa als gràfics vectorials, llegiu la transició a SVG en Commons. També hi ha informació quant a la compatibilitat del MediaWiki amb les imatges SVG. |
 |
Instructions
See Wikipedia graph-making tips.
Plotted in Maxima with the following commands:
u(t) := 1/2*(1+signum(t));
rect(t) := u(t + 1/2) - u(t - 1/2);
A train of rectangular pulses (or a square wave). This should be n=−∞..+∞, but I can't get Maxima to evaluate it, so I just chose n values that would give a close enough approximation for the visible area:
train(t) := sum(rect(t-2*n),n,-10,20);
The Hilbert transform of a rectangular pulse:
hrect(t) := log(abs((t+1/2)/(t-1/2)))/%PI;
A "train" of hrects. Again with the approximation, though this time it actually matters (rectangular function is 0 everywhere; this is not.):
htrain(t) := sum(hrect(t-2*n),n,-100,100);
The plot command:
plot2d([train(t)-0.5,htrain(t)],[t,0,6],[y,-1,1],[nticks,500], [gnuplot_preamble,"set grid; set ytics 1; set nokey"], [gnuplot_ps_term_command,"set term postscript enhanced landscape color solid lw 2 'Times-Roman' 20"], [gnuplot_term,ps], [gnuplot_out_file,"hilbert.ps"]);
This causes gnuplot to create a .ps file.
To convert the PostScript file to PNG:
- Open it in the GIMP (make sure you have ghostscript installed! - Windows instructions)
- Enter 500 under Resolution (it doesn't say "DPI" but I think that's what it means)
- Uncheck Try bounding box (since the bounding box cuts off the edge, unfortunately. You can try with the bounding box first.)
- Enter large values for Width and Height
- Check Color
- Check Strong anti-aliasing for both graphics and text
- Crop off extra whitespace (Shift+C if you can't find it in the toolbox)
- Possibly need to rotate it: Click Image → Transform → Rotate 90 degrees clockwise
Filters → Blur → Gaussian blur at 2.0 px(No need to blur if you use strong anti-aliasing during conversion. I see no significant difference between end results.)- Image → Scale Image...
- Width and Height at 25%
- Cubic interpolation
- You can view at normal size if you want by pressing 1, Ctrl+E
- Save as Hilbert transform.png
Original version of this plot was made in GNU Octave with the command:
imag(hilbert(x))
Created by User:Omegatron using gnuplot, possibly with post-processing in the GIMP (PNG) or Inkscape (SVG)
- Sou lliure de:
- compartir – copiar, distribuir i comunicar públicament l'obra
- adaptar – fer-ne obres derivades
- Amb les condicions següents:
- reconeixement – Heu de donar la informació adequada sobre l'autor, proporcionar un enllaç a la llicència i indicar si s'han realitzat canvis. Podeu fer-ho amb qualsevol mitjà raonable, però de cap manera no suggereixi que l'autor us dóna suport o aprova l'ús que en feu.
- compartir igual – Si modifiqueu, transformeu, o generareu amb el material, haureu de distribuir les vostres contribucions sota una llicència similar o una de compatible com l'original

|
S'autoritza la còpia, la distribució i la modificació d'aquest document sota els termes de la llicència de documentació lliure GNU versió 1.2 o qualsevol altra versió posterior que publiqui la Free Software Foundation; sense seccions invariants, ni textos de portada, ni textos de contraportada. S'inclou una còpia d'aquesta llicència en la secció titulada GNU Free Documentation License. |
(In short, this means that you can copy and modify the image freely as long as you provide attribution; preferably in the form of a link back to this page.)
Historial del fitxer
Cliqueu una data/hora per veure el fitxer tal com era aleshores.
| Data/hora | Miniatura | Dimensions | Usuari/a | Comentari | |
|---|---|---|---|---|---|
| actual | 20:54, 2 jul 2005 | | 1.600 × 1.120 (120 Ko) | Omegatron | Image of the Hilbert transform of a square wave. |
| 21:53, 26 juny 2005 |  | 608 × 433 (5 Ko) | Omegatron | A graph or diagram made by User:Omegatron. (Uploaded with Wikimedia Commons.) Source: Created by User:Omegatron {{GFDL}}{{cc-by-sa-2.0}} Category:Diagrams\ |
Ús del fitxer
La pàgina següent utilitza aquest fitxer:
Ús global del fitxer
Utilització d'aquest fitxer en altres wikis:
- Utilització a ar.wikipedia.org
- Utilització a es.wikipedia.org
- Utilització a fa.wikipedia.org
- Utilització a fr.wikipedia.org
- Utilització a zh.wikipedia.org