
Fitxer:MultivariateNormal.png
Mida d'aquesta previsualització: 793 × 600 píxels. Altres resolucions: 317 × 240 píxels | 635 × 480 píxels | 842 × 637 píxels.
Fitxer original (842 × 637 píxels, mida del fitxer: 159 Ko, tipus MIME: image/png)
| Aquest fitxer i la informació mostrada a continuació provenen del dipòsit multimèdia lliure Wikimedia Commons. |

|
File:Multivariate normal sample.svg és una versió vectorial (SVG) d'aquest fitxer. En cas de ser millor, hauria de ser emprada en lloc d'aquesta imatge tramada.
File:MultivariateNormal.png → File:Multivariate normal sample.svg
Per a més informació pel que fa als gràfics vectorials, llegiu la transició a SVG en Commons. També hi ha informació quant a la compatibilitat del MediaWiki amb les imatges SVG. |
 |
Resum
| Descripció |
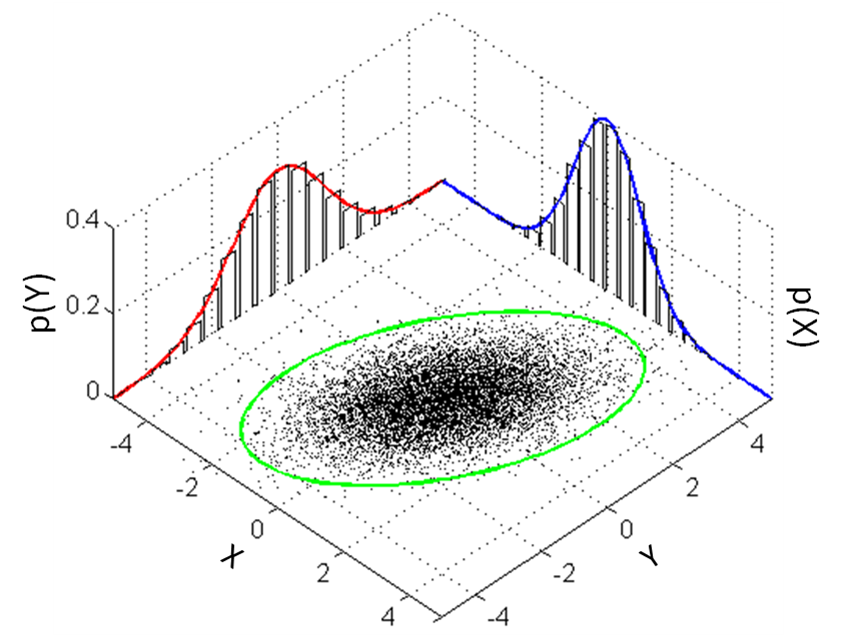
English: Illustration of a multivariate gaussian distribution and its marginals. Matlab code provided below. |
| Data | |
| Font | Treball propi |
| Autor | Bscan |
%This script illustrates a multivariate Gaussian distribution and its
%marginal distributions

%This code is issued under the CC0 "license"

%Define limits of plotting
X = -5:0.1:5;
Y = -5:0.1:5;

%2-d Mean and covariance matrix
MeanVec = [0 0];
CovMatrix = [1 0.6; 0.6 2];

%Get the 1-d PDFs for the "walls"
Z_x = normpdf(X,MeanVec(1), sqrt(CovMatrix(1,1)));
Z_y = normpdf(Y,MeanVec(2), sqrt(CovMatrix(2,2)));

%Get the 2-d samples for the "floor"
Samples = mvnrnd(MeanVec, CovMatrix, 10000);

%Get the sigma ellipses by transform a circle by the cholesky decomp
L = chol(CovMatrix,'lower');
t = linspace(0,2*pi,100); %Our ellipse will have 100 points on it
C = [cos(t) ; sin(t)]; %A unit circle
E1 = 1*L*C; E2 = 2*L*C; E3 = 3*L*C; %Get the 1,2, and 3-sigma ellipses

figure; hold on;
%Plot the samples on the "floor"
plot3(Samples(:,1),Samples(:,2),zeros(size(Samples,1),1),'k.','MarkerSize',2)
%Plot the 1,2, and 3-sigma ellipses slightly above the floor
%plot3(E1(1,:), E1(2,:), 1e-3+zeros(1,size(E1,2)),'Color','g','LineWidth',2);
%plot3(E2(1,:), E2(2,:), 1e-3+zeros(1,size(E2,2)),'Color','g','LineWidth',2);
plot3(E3(1,:), E3(2,:), 1e-3+zeros(1,size(E3,2)),'Color','g','LineWidth',2);

%Plot the histograms on the walls from the data in the middle
[n_x, xout] = hist(Samples(:,1),20);%Creates 20 bars
n_x = n_x ./ ( sum(n_x) *(xout(2)-xout(1)));%Normalizes to be a pdf
[~,~,~,x_Pos,x_Height] = makebars(xout,n_x);%Creates the bar points
plot3(x_Pos, Y(end)*ones(size(x_Pos)),x_Height,'-k')

%Now plot the other histograms on the wall
[n_y, yout] = hist(Samples(:,2),20);
n_y = n_y ./ ( sum(n_y) *(yout(2)-yout(1)));
[~,~,~,y_Pos,y_Height] = makebars(yout,n_y);
plot3(X(1)*ones(size(y_Pos)),y_Pos, y_Height,'-k')

%Now plot the 1-d pdfs over the histograms
plot3(X, ones(size(X))*Y(end), Z_x,'-b','LineWidth',2);
plot3(ones(size(Y))*X(1), Y, Z_y,'-r','LineWidth',2);

%Make the figure look nice
grid on; view(45,55);
axis([X(1) X(end) Y(1) Y(end)])
Llicència
Jo, el titular dels drets d'autor d'aquest treball, el public sota la següent llicència:
| L'ús d'aquest fitxer és regulat sota les condicions de Creative Commons de CC0 1.0 lliurament al domini públic universal. | |
| La persona que ha associat un treball amb aquest document ha dedicat l'obra domini públic, renunciant en tot el món a tots els seus drets de d'autor i a tots els drets legals relacionats que tenia en l'obra, en la mesura permesa per la llei. Podeu copiar, modificar, distribuir i modificar l'obra, fins i tot amb fins comercials, tot sense demanar permís.
|
Historial del fitxer
Cliqueu una data/hora per veure el fitxer tal com era aleshores.
| Data/hora | Miniatura | Dimensions | Usuari/a | Comentari | |
|---|---|---|---|---|---|
| actual | 21:30, 22 març 2013 | | 842 × 637 (159 Ko) | Bscan | User created page with UploadWizard |
Ús del fitxer
La pàgina següent utilitza aquest fitxer:
Ús global del fitxer
Utilització d'aquest fitxer en altres wikis:
- Utilització a ar.wikipedia.org
- Utilització a be.wikipedia.org
- Utilització a cbk-zam.wikipedia.org
- Utilització a da.wikipedia.org
- Utilització a de.wikipedia.org
- Utilització a en.wikipedia.org
- Utilització a es.wikipedia.org
- Utilització a fa.wikipedia.org
- Utilització a fi.wikipedia.org
- Utilització a gl.wikipedia.org
- Utilització a ja.wikipedia.org
- Utilització a ko.wikipedia.org
- Utilització a pt.wikipedia.org
- Utilització a ru.wikipedia.org
- Utilització a sm.wikipedia.org
- Utilització a sr.wikipedia.org
- Utilització a uk.wikipedia.org
- Utilització a www.wikidata.org