
Fitxer:Ukrainian parliamentary election, 2007 (ResultsByRegion).PNG
No hi ha cap versió amb una resolució més gran.
Ukrainian_parliamentary_election,_2007_(ResultsByRegion).PNG (768 × 480 píxels, mida del fitxer: 15 Ko, tipus MIME: image/png)
| Aquest fitxer i la informació mostrada a continuació provenen del dipòsit multimèdia lliure Wikimedia Commons. |
.PNG?uselang=ca)
Resum
| Descripció |
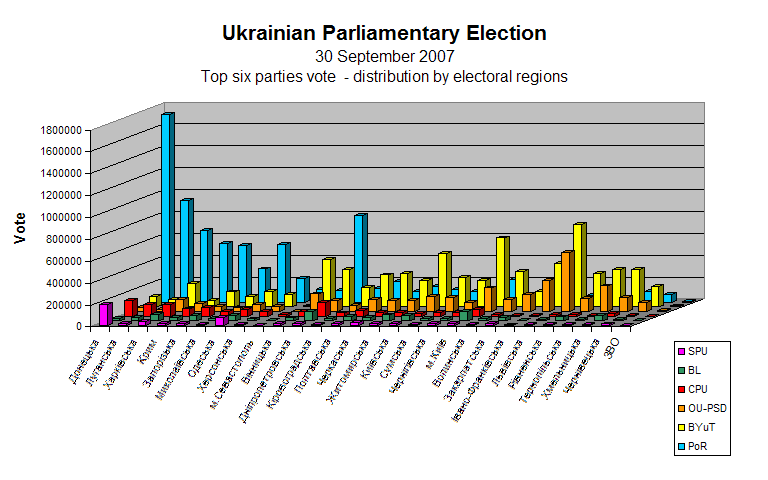
English: Ukrainian parliamentary election, 2007. |
| Data | |
| Font | Self-made based off map by Muumi with data from Central Election Commission of Ukraine |
| Autor | User:DemocracyATwork |
| Permís (Com reutilitzar aquest fitxer) |
Aquest fitxer està publicat sota la llicència de Creative Commons Reconeixement i Compartir Igual 1.0 Genèrica. Reconeixement: DemocracyATwork
|
| Altres versions |
|
.PNG)
Collection
.PNG) |
.PNG) |
.PNG)
|
Regional Analysis of the parliamentary elections:
.PNG) |
.PNG)
|
.PNG)
|
.PNG)
|
v.PNG) |
v.PNG) |
v.PNG) |
v.PNG) |
v.PNG) |
v.PNG) |
a.PNG) |
a.PNG) |
a.PNG) |
a.PNG) |
a.PNG) |
a.PNG) |
.PNG) |
.PNG) |
.PNG) |
.PNG) |
.PNG) |
.PNG) |
2006 [7] [8] [9] [10] [11] [12]
A swing analysis is common in any election. It shows the change in voter percentage for each party by regions from 2006 to 2007.
Llicència
| Jo, el titular del copyright d'aquesta obra, l'allibero al domini públic. Això s'aplica a tot el món. En alguns països això pot no ser legalment possible, en tal cas: Jo faig concessió a tothom del dret d'usar aquesta obra per a qualsevol propòsit, sense cap condició llevat d'aquelles requerides per la llei. |
- ↑ Template:Cite gov
- ↑ Template:Cite gov
- ↑ Template:Cite gov
- ↑ Template:Cite gov
- ↑ Template:Cite gov
- ↑ Template:Cite gov
- ↑ Template:Cite gov
- ↑ Template:Cite gov
- ↑ Template:Cite gov
- ↑ Template:Cite gov
- ↑ Template:Cite gov
- ↑ Template:Cite gov
Historial del fitxer
Cliqueu una data/hora per veure el fitxer tal com era aleshores.
| Data/hora | Miniatura | Dimensions | Usuari/a | Comentari | |
|---|---|---|---|---|---|
| actual | 19:09, 20 feb 2008 | | 768 × 480 (15 Ko) | DemocracyATwork | Ukrainian Parliamentary Election 2007 Results of election (Top six parties vote by region) chart. Removed boarder. |
| 01:09, 18 feb 2008 |  | 750 × 479 (14 Ko) | DemocracyATwork | Update to reflect color change for Bloc Lytvyn to match with the Parliamentary seat allocation map. From grey to geen. | |
| 16:32, 13 feb 2008 |  | 750 × 479 (14 Ko) | DemocracyATwork | == Summary == {{Information |Description='''English:''' Ukrainian parliamentary election, 2007 sorted to better correlate to data table. |Source=Self-made based off [[:Image:Wahlkreise ukraine 2006 eng.png|ma | |
| 10:52, 8 feb 2008 |  | 750 × 479 (19 Ko) | DemocracyATwork | == Results - Ukrainian Election 2007 Collection == {| class="wikitable" |- |+ Results of the Ukrainian parliamentary elections: |- | 400px|center|Top six parties vote | [[Image:Ukrainian parliame |
.PNG)
Ús del fitxer
La pàgina següent utilitza aquest fitxer:
Ús global del fitxer
Utilització d'aquest fitxer en altres wikis:
- Utilització a de.wikipedia.org
- Utilització a en.wikipedia.org
- Talk:Yulia Tymoshenko Bloc
- Talk:Party of Regions
- Talk:Our Ukraine–People's Self-Defense Bloc
- Talk:Elections in Ukraine
- Talk:2007 Ukrainian parliamentary election/Archive 1
- File talk:Ukrainian parliamentary election 2007 second place resultsNeutral.PNG
- User talk:DemocracyATwork~enwiki
- File talk:Ukrainian parliamentary election, 2007 (first place results).PNG
- User talk:Yulia Romero/Archive 2
- Utilització a es.wikipedia.org
- Utilització a fi.wikipedia.org
- Utilització a fr.wikipedia.org
- Utilització a hu.wikipedia.org
- Utilització a it.wikipedia.org
- Utilització a pl.wikipedia.org
- Utilització a ru.wikipedia.org
- Utilització a uk.wikipedia.org
.PNG)
.PNG)